of geospatial solutions
Sat-Sun: Non-working days
Abstract
This article examines methods for assessing insurance risks using remote sensing (RS) of the Earth. The application of this method for analyzing and assessing insurance risks or evaluating the occurrence of insurance events will be discussed in detail. The article will help readers understand the advantages of using RS in insurance risk assessment and will also demonstrate its importance for effective management and minimization of potential losses.
Introduction
According to UN estimates, over the course of three years starting from 2021, the damage from natural disasters, including uninsured losses, exceeded $784 billion. It is reported that by 2023, insurance companies Gallagher Re estimated total insured losses from natural catastrophes to be over $100 billion, marking the sixth occurrence since 2017. In 2022, total insurance compensation from natural disasters amounted to $115 billion, and in 2021 – $121 billion. For 2023, insurance covered approximately half of the total damage. Conversely, in 2022 and 2021, insurance coverage accounted for only 43% and 38%, respectively, of the total damage caused by natural disasters.
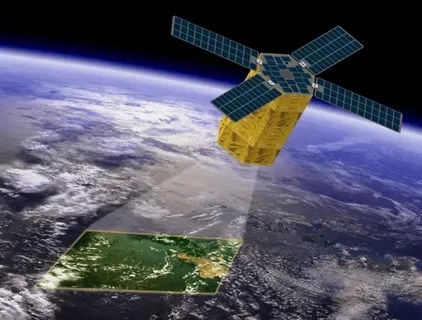
Remote sensing (RS) of the Earth is a technology that allows information about the Earth to be obtained using satellites, drones, and other unmanned systems. Today, the development of this field is advancing rapidly, enabling data to be obtained with high accuracy and update frequency. Thanks to such advancements, the information collected through RS is widely used in various fields, including agriculture, geology, hydrometeorology, ecology, urban planning, and insurance.
In the context of insurance, data obtained through RS becomes a valuable tool for risk assessment and management. With accurate and up-to-date information provided by remote sensing, insurance companies can more effectively analyze potential threats and develop insurance strategies based on objective data.
In the insurance sector, remote sensing of the Earth is applied in various directions:
- Agricultural insurance: Monitoring crops, assessing soil conditions, and detecting plant pathologies using RS help reduce the risk of insurance claims and optimize the processes of insuring agricultural lands.
- Real estate and property insurance: RS is used for monitoring and identifying threats such as landslides, fire-prone areas, and floods, contributing to the development of customized insurance products.
- Natural disaster insurance: Given the ability to forecast floods, fires, and other natural disasters using RS, insurance companies can offer more flexible and adaptive insurance policies, minimizing potential risks for their clients.
All these aspects highlight the importance of applying remote sensing of the Earth in the insurance sector, enhancing the accuracy of risk assessment, improving the reliability of insurance products, and improving risk management for both insurers and clients. Next, we will examine the main methods that can optimize and enhance the process of insurance and assessment of insurance events.
Methods for Assessing Insurance Risks Using Remote Sensing (RS) of the Earth
In the insurance sector, RS has long been actively used for insurance risk assessment. This is because the data obtained through RS methods can be used to analyze and forecast various potential threats and risks, such as floods, fires, natural disasters, and other events that may lead to insurance claims. Subsequently, insurers need to assess the incurred risk: whether an insured event has occurred and the extent of the damage. In this situation, remote sensing data can be extremely helpful.
The main methods for assessing insurance risks using RS include:
- Classification of formations. This method allows for the automatic classification of objects in images obtained through RS, which helps to identify and analyze potentially hazardous areas or objects.
- Multispectral analysis. Using data obtained from various spectral ranges, it is possible to detect changes in the Earth's surface conditions and track environmental dynamics over time. Multispectral and hyperspectral data allow for the creation of index images that provide qualitative information about objects: their composition, structure, vegetation condition, presence of moisture, or other components.
- Analysis based on radar data. This method allows for the analysis of surfaces considering their relief and structure, which is useful for assessing insurance risks associated with various surface forms. The active sensing method provides highly accurate surface data even during heavy cloud cover. It is most commonly used for analyzing surface displacements.
- Analysis of very high-resolution data. High-quality satellite images provide information about the area in near real-time, making monitoring more operational and risk analysis more accurate.
Innovative Approaches in Risk Assessment
Currently, in many developed countries, one of the leading methods for assessing incurred damage is index-based insurance. This method was developed to simplify the damage assessment process in areas with heterogeneous risk factors and has made older methods less relevant, as they often relied on complex and subjective loss verification processes, making them less efficient and costly.
What is Index-Based Insurance?
Index-based insurance is a methodology that relies on a characteristic index, such as a vegetation health index, weather, precipitation, etc. This index is formed based on RS data collected from space or aerial surveys, allowing for the assessment of crop conditions over large areas. The advantage of index-based insurance is that it relies on objective data about crop conditions rather than subjective assessments, making it more accurate and accessible for widespread use. The index was created to simplify the damage verification and assessment process and to make insurance more efficient and transparent.
Why Was the Shift to Index-Based Insurance Necessary?
One of the main issues that prompted the shift to index-based insurance was the complexity and delays associated with assessing actual damages, especially in the case of natural disasters, climate changes, and other factors affecting crop yields. Traditional insurance methods, which required on-site visits and complex loss verification processes, became less efficient and economically unfeasible. Additionally, traditional methods were often used in areas with heterogeneous risk factors. Crop loss on clay soils and black soils would be considered the same by insurance companies, leading to issues of unfair assessment. Index-based insurance evaluates cases independently of others and based on case-specific indices.
Index-based insurance, with the help of objective indices and readily available RS data, provides a more accurate and timely risk assessment, allowing insurers and farmers to manage the financial impacts of natural disasters and other adverse events more effectively, reducing time delays and lowering administrative costs.
Risk Prediction of Insurance Claims
Predicting floods and inundations (retrospective analysis), including annual floods
Predicting the risk of insurance claims due to flooding and inundation is a crucial aspect for insurance companies and government agencies, as these natural disasters annually cause significant material damage and emergencies in our country. In April 2024, Orsk experienced the largest flood in modern Russian history, with preliminary data indicating about 12,000 homes were flooded, resulting in over 21 billion rubles in damage.
One of the simplest and most commonly used methods for predicting flood and inundation zones is continuous monitoring and forecasting of water levels in the most dangerous and critical areas along floodplains, reservoirs, etc. Various water indices are used to assess potential threats and map water bodies, such as:
Weighted Difference Vegetation Index (WDVI):
WDVI = NIR - g * RED, where g is the slope of the soil line
Normalized Difference Water Index (NDWI) detects changes in water bodies:
NDWI = (GREEN - NIR) / (GREEN + NIR)
Normalized Difference Moisture Index (NDMI) measures the moisture content in plants:
NDMI = (NIR - SWIR) / (NIR + SWIR)
or radar data, which are not affected by cloud cover due to the properties of radio waves.
With a wide variety of water indices and methods for automatic and machine classification of satellite images (such as Random Forest or neural network classifications), as well as archival data over several years, predictive models of flooded areas can be built. Since the late 20th century, annual archives of RS data have been created for the entire Earth's territory, making predictive models more accurate. This forecasting method is called retrospective analysis - a research method where past data and facts are analyzed to identify trends, patterns, and cause-effect relationships.
Another crucial aspect of forecasting is monitoring the condition of dams. Dam failures have led to the largest floods in recent years.
The state of reservoir dams can be investigated using the method of radar differential interferometry. Differential Interferometric Synthetic Aperture Radar (D-InSAR) is based on the physical processes of radio wave interference reflected from the Earth's surface. This method measures the slightest changes in distance between the instrument and the surface by examining phase changes in signals.
D-InSAR detects changes in the height and movement of dams, which can indicate hidden deformations, such as those related to potential collapse threats. This method provides continuous monitoring, allowing for timely responses to changes and preventive measures against emergency situations. Thus, D-InSAR is a crucial tool for ensuring the safety and reliability of dams and reservoirs by detecting potential threats and conducting timely technical inspections and problem-solving.
 before dam failure")
 before dam failure (chart)")
The risk of dam failure significantly increases the risk of flooding in settlements downstream. Modeling the flood zone (?).
The risk of landslides and mudflows
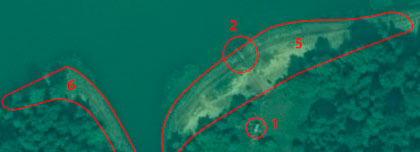
Landslides and mudflows are major geological disasters that always cause significant socio-economic damage. Predicting landslide and mudflow susceptibility plays a critical role in environmental monitoring, ecological protection, settlement planning, and insurance. The primary method for predicting landslides is the previously mentioned radar interferometry. Scientific studies confirm that using radar interferometry significantly increases the accuracy of predicting landslides and mudflows. The vast amount of data and its analysis not only allow for assessing the likelihood of such events but also predicting them with a certain degree of confidence. You can learn more about this in our article.
 overlaid on an orthophotomap of the predicted landslide area")
Risk of Drought and Desertification
One common approach to predicting drought is using a group of drought indices, such as:
Normalized Difference Water Index (NDWI)
NDWI = (GREEN - NIR) / (GREEN + NIR)
This index was initially created to study water bodies on Earth's surface using satellites. Data is obtained by combining channels that capture signals in the near-infrared range and the green area of the visible spectrum.
Modified Combined Drought Index (mCDI)
mCDI = α * dNDVI + β * dPrecipitation + σ * dSoil Moisture
The Combined Drought Index (CDI) was developed based on a three-month cumulative deficit of antecedent precipitation and a monthly vegetation activity deficit with a one-month lag between them. Key biophysical (e.g., NDVI) and hydro-meteorological (e.g., precipitation) variables obtained from geostationary satellite observations were used in formulating the CDI. CDI is a potential indicator for assessing regional agricultural drought at the end of the season, based on the delayed response between water supply and crop strength.
Leaf Area Index (LAI)
LAI = leaf area (m²) / ground area (m²)
This index was developed to analyze the leaf surface area on our planet and assesses the number of leaves in a specific area. LAI is calculated as the ratio of the one-sided (illuminated) leaf area to the surface area occupied by them.
Analyzing these and other indices based on remote sensing data can help identify areas with increased drought risk.
Another method used to assess drought insurance risks is using radar survey data, such as data from Sentinel-1 satellites, to monitor soil moisture. Soil moisture information obtained from such data can be crucial for calculating insurance premiums and determining crop risk due to drought.
Overall, combining remote sensing data with drought indices and soil moisture information allows insurers and agricultural companies to more accurately predict and manage risks associated with drought, leading to more effective and reliable crop and agricultural product insurance.
Why Use Remote Sensing Data?
The use of remote sensing data (RSD) in insurance is driven by their ability to provide diverse and reliable information about insured objects such as agricultural land, real estate, and others. RSD allows for:
- Wide coverage and data availability: RSD enables the collection of information about various parts of the Earth, including remote and inaccessible areas. This ensures broad coverage for monitoring and analyzing insurance risks.
- High spatial and temporal resolution: RSD provides high-quality information with high resolution in spatial and temporal parameters. This allows for detailed study of changes and trends related to risks such as climatic conditions and natural disasters.
- Diversity of data and spectral information: RSD can capture data in various spectral ranges, allowing analysis of different environmental aspects, including soil, water, vegetation parameters, and other factors important for risk assessment.
- Monitoring and forecasting: Thanks to RSD's ability to observe changes in real-time, analyze them, and make forecasts, this method becomes a key tool for monitoring and predicting risks associated with natural and anthropogenic phenomena.
- Efficiency and resource savings: Using RSD for insurance risk assessment not only enhances the efficiency of the analysis and decision-making process but also helps save resources by reducing the need for extensive field measurements and surveys.
- Accuracy and reliability: Data obtained through RSD is highly accurate, allowing for confident risk determination and making well-founded decisions based on reliable information.
- Operational efficiency: The ability to obtain and analyze data in near real-time allows for quick responses to emerging risks and events, significantly reducing response time and minimizing potential losses.
- Scalability: RSD allows for scaling monitoring and risk analysis processes according to needs, making it a versatile tool for tasks of varying scales and territories.
- Innovativeness: The continuous development of RSD technologies provides access to more advanced methods of risk analysis and forecasting, enhancing the efficiency and accuracy of assessments.
- Resilience to external factors: Using RSD in risk assessment represents a resilient approach that is less dependent on many external factors, ensuring the reliability and stability of analysis results.
All these factors significantly enhance the efficiency of insurance processes.
Damage Assessment Using Remote Sensing
From Hurricanes and Hail
When studying the consequences of hurricanes, satellite monitoring plays a key role. It allows for the rapid determination of the scale of destruction, their localization, and their impact on the environment. Analyzing satellite data helps assess damage to agricultural lands, forests, and infrastructure. The insights gained assist in preparing for future natural disasters and developing measures to prevent and mitigate risks.
From Floods
RSD provides the ability to quickly assess damage from floods. Analyzing satellite images allows for identifying flooded areas, determining the scale of inundation, evaluating ecosystem services, and implementing measures for the recovery of affected zones. This information is valuable for effectively coordinating aid to victims and developing water resource management plans to prevent similar disasters in the future. You can read more in our article.
From Fires
Aerospace imagery in assessing fire damage allows for the analysis of damage to forests, agricultural lands, infrastructure, and settlements. Specialized image processing algorithms help identify fire zones, fire spread, and its sources. The data obtained is used to develop measures for the restoration of territories, control potential environmental impacts, and assess threats to the population. You can read more in our article.
From Drought
Data obtained by RSD methods can help assess drought damage by analyzing changes in vegetation cover, soil conditions, and water resource availability. Spectral data from satellites allow for identifying areas with increased aridity, predicting agricultural crop yields, and taking measures to mitigate the impact of drought on agriculture and ecosystems. You can read more in our article.
From Desertification
Aerospace monitoring assesses desertification damage by tracking and analyzing changes in vegetation cover, soil structure, and water resource distribution. Analyzing satellite data helps identify areas at increased risk of desertification, assess the rate of desert spread, and develop measures to improve land use and restore degraded areas. You can read more in our article.

From Environmental Disasters, Oil Spills, Chemical Spills, and More
Remote sensing allows for quick assessment of damage from environmental disasters such as oil spills or chemical spills. Analyzing RSD data helps determine the scale of pollution, its spread, and its impact on the environment and living organisms. The information obtained is used to take measures to reduce harm, restore ecosystems, and identify responsible parties while developing strategies to prevent similar disasters in the future. You can read more in our article.
Application
A study was conducted to explore the potential and actual support of remote sensing for insurance related to agriculture. The study revealed that the use of remote sensing in traditional loss-based insurance, as described in the literature, primarily pertains to crop damage and the assessment of flood and fire risks.
This finding led to the conclusion that insurance companies offer various index insurance products based on remote sensing. For example, index insurance for vegetation and livestock on pastures is already operational, and various applications in crop index insurance are being considered or developed. The study found that there is a particular area of application for remote sensing by the insurance industry in index insurance products because (1) indices can be created that correlate well with what is insured; (2) these indices can be provided at a low cost; and (3) it opens new markets that are not served by traditional loss-based insurance.
The study concluded that the limited implementation of remote sensing in insurance is due to a lack of mutual understanding and calls for greater collaboration between the insurance industry and the remote sensing community to expand the practical application of this technology.
The study emphasizes several challenges that need to be addressed to promote the use of remote sensing in index insurance. This includes creating or maintaining a favorable environment ready to subsidize insurance, as well as solving several technical issues in remote sensing. The main problem is the slow adoption of remote sensing in the insurance sector, which is the result of mutual misunderstanding of the opportunities offered by the remote sensing community and the insurance industry.
The entire discussion in the study highlights the necessity for deeper cooperation between the remote sensing community, economists, agrometeorologists, and insurers for a more effective approach to developing successful remote sensing applications in insurance.


Sat-Sun: Non-working days