of geospatial solutions
Sat-Sun: Non-working days
In 2019, Russia was hit by a terrible disaster - forest fires. They occurred due to various reasons: drought, high temperatures, strong winds, and even arson. It is believed that the fires in the Irkutsk region (proportionally the most affected region in terms of total area) were an attempt to conceal illegal logging. The total area of fires in Russia exceeded 2 million hectares, and the economic damage amounted to more than 7 billion rubles. And this is only direct damage. Fires also affect air quality, human and animal health, and destroy their natural habitats, etc.
This problem is not unique to Russia. The area of fires in the United States over the past 10 years has exceeded 10 million hectares, and wildfires are becoming more extensive every year.
One of the most disastrous years in the United States was 2015. Forest fires almost completely devastated Glacier National Park (an area of over 4,000 square kilometers) in Montana (USA). The damage was enormous, and recovery is ongoing to this day. After the fires, the park management decided to measure the areas of damaged areas in order to plan reforestation efforts based on data on the area of burns. Fires are present in the ecology of this area as a natural factor, but monitoring their scale is very important for forest management services. The most practical way to monitor the consequences of fires and plan restoration measures is to use Earth remote sensing data (RS). Using ArcGIS software and Landsat 8 satellite images before and after the fires, the process of evaluation was restored, the normalized burn ratio (NBR) was calculated, and a thematic map was compiled.

Figure 1. Glacier National Park Image
For the project, we selected two images before and after the fires.

Figure 2 Landsat-8 Satellite Image, August 2014
Mountainous terrain is characterized by valleys and lakes. Some mountain ranges are covered with snow, while others are covered with clouds. The satellite image was taken in August, and there may be glaciers in the mountains. We also see a fairly dense vegetation cover. The type of vegetation and slope affect forest fires, especially their spread rate. This is how the area looked in 2014, before the Reynolds Creek and Thompson fires. Now let's look at the 2015 satellite image.

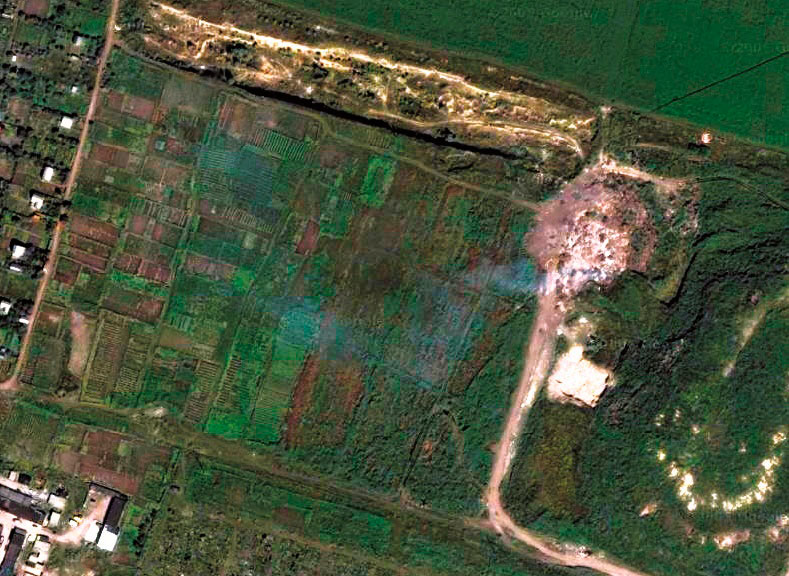
Figure 3 Landsat-8 Satellite Image, 2015
There are two clear differences in the 2015 image compared to the 2014 image. Firstly, a large gray cloud covers the middle of the southern part of the image. In fact, this is the smoke of the Thompson fire, which was still burning at the time. Secondly, to the left and above the lake in the middle of the northern part of the image, we see a long reddish strip - the burn of the Reynolds Creek fire, which had already extinguished by this time. Although we see both fires, their boundaries need clarification. Next, we will change the channel combination of the images to highlight the fires.
Landsat-8 Channel Combination
In Landsat images, various sectors of the electromagnetic spectrum are captured, including those invisible to the human eye. Ranges of wavelengths are called spectral channels. The channels are described in the following table:
Table №1. Landsat-8 Spectral Channels| Number | Channel Name | Best Shows |
|---|---|---|
| 1 | Coastal Aerosol | Shallow waters, fine dust particles |
| 2 | Blue | Deep water, atmosphere |
| 3 | Green | Vegetation |
| 5 | Near Infrared | Coastlines, vegetation |
| 6 | ShortWaveInfrared_1 | Cloud penetration, soil moisture and vegetation |
| 7 | ShortWaveInfrared_2 | Enhanced cloud penetration, soil moisture and vegetation |
| 8 | Panchromatic | Black and white images, sharp details |
| 9 | Cirrus, SWIR | Cirrus clouds |
| 10 | Thermal Infrared 1 | Thermal mapping, soil moisture assessment |
| 11 | Thermal Infrared 2 | Enhanced thermal mapping, soil moisture assessment |
Channels 2, 3, and 4 (blue, green, and red) represent the visible part of the spectrum. The "Natural Color" combination commonly used in images combines these channels in a way that makes the image look like it is seen by the human eye. Next, we will change the channel combination of the images to highlight the fires and make their outlines more distinguishable. Let's look at some of them:
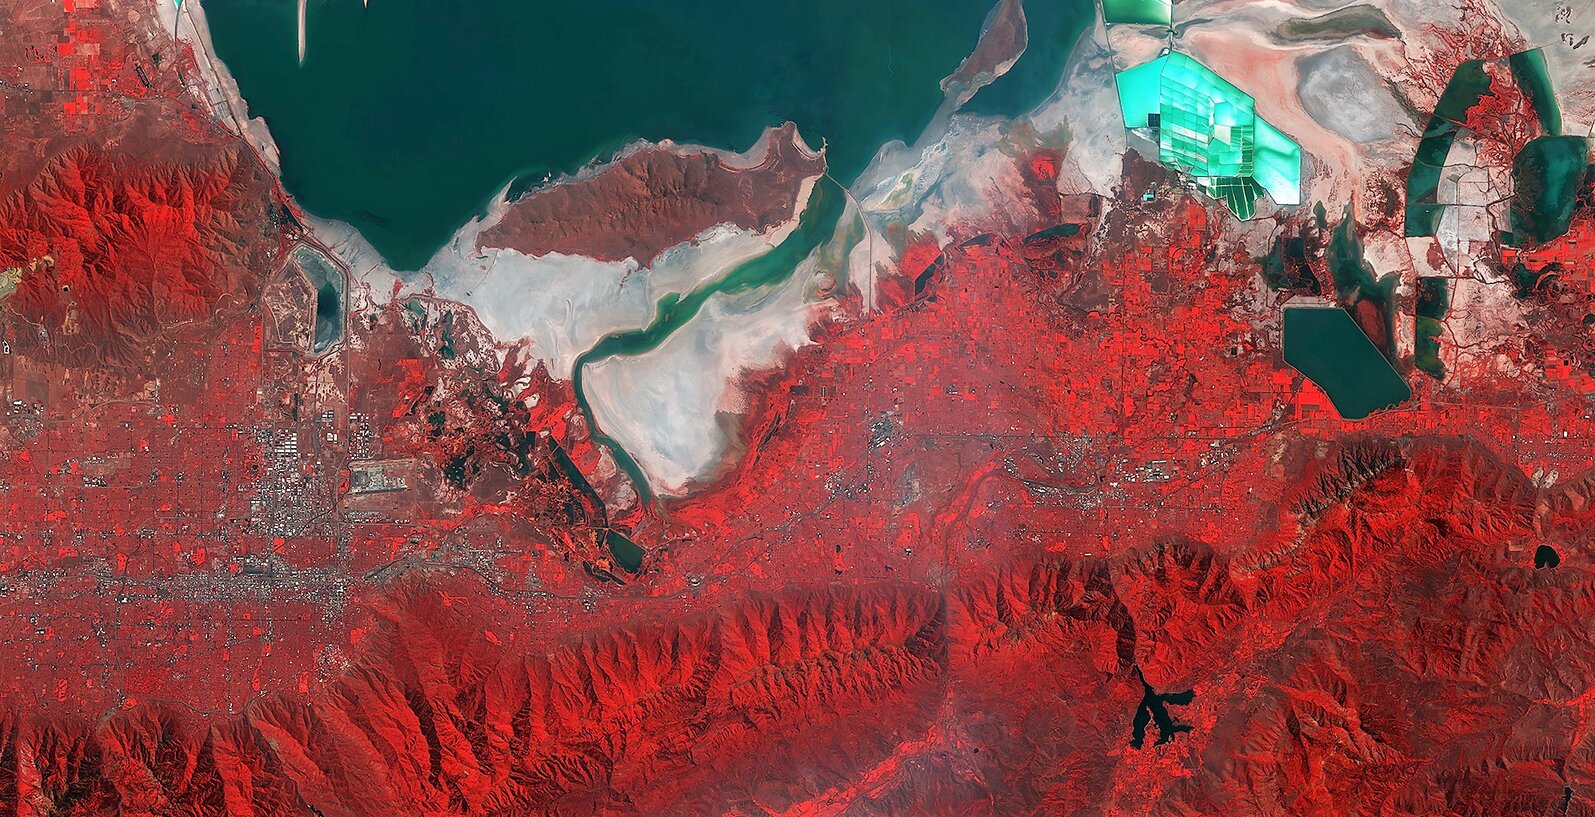
This combination is built from the near infrared, red, and green channels (5, 4, and 3).

Figure 4. Satellite Image in Infrared Color
In this image, vegetation is shown in red. Both burn areas are shown in dark brown. Compared to the original image, burns are more clearly visible, especially Reynolds Creek to the north of the lake. However, the Thompson burn is still obscured by smoke. Now let's experiment with a combination using the ShortWave Infrared channels (6 and 7), which penetrate through clouds.

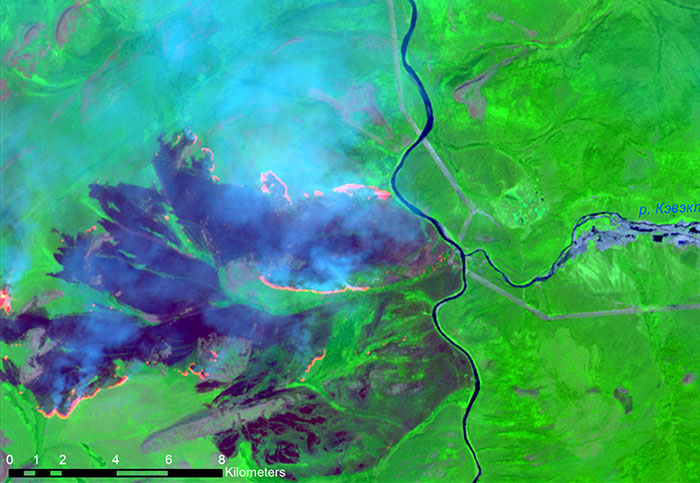
Figure 5. Satellite Image in Land/Water Surface Combination
Although the primary purpose of this combination is to distinguish between land and water, it also penetrates through smoke (in this case, smoke). Now, in the vicinity of the Thompson burn, smoke is hardly visible, and its boundaries are much clearer. But the burned areas are shown in orange, and the surrounding mountain slopes are yellow. Because of this, the Reynolds Creek burn, which is spread in the mountains, is less visible.
Conclusion
After changing the channel combination of the Landsat 8 images, we can more clearly see the borders of the burns. For further research, we will use this knowledge and the data for our own research.
You can order from us


Sat-Sun: Non-working days