your companion in the world
of geospatial solutions
of geospatial solutions
Operation mode:
Mon-Fri: 10:00 - 18:00
Sat-Sun: Non-working days
Radar imaging and its derivative products are gaining popularity. This can be easily explained by the features of this type of Earth imaging: neither weather nor time of day significantly affects the image quality.
Radar imaging (SAR) is a type of space imaging that uses the microwave radiation range with wavelengths from 1 cm to 1 m to obtain information. SAR is an active method of remote sensing. Satellites are equipped with synthetic aperture radar (SAR), which allows for imaging.
The first SAR tests were conducted in the USA and the USSR in the 1960s for ship detection in high latitudes and other military purposes. In 1968, the Laboratory of Aeromethods of the Ministry of Geology of the USSR began the first tests of area radar aerial photography for geological purposes. Soviet side-looking radar systems (SLRS) "Toros" and "Nith" were used in the tests. The first space radar imaging with a resolution of 25 m was carried out in 1978 from the SeaSAT satellite. In 1981, images with a spatial resolution of 40 m were taken by the space shuttle. The active use of radar imaging began in 1991 with the launch of the ERS-1 satellite with a radar. Initially, the purpose of using the first civilian radar satellite with medium spatial resolution (20 m) was limited to monitoring the seas. However, after the satellite completed several full orbits around the Earth, it was found that, besides marine applications, this satellite had great potential for solving various tasks on land.
Table 1. The most common radar imaging bands
|
Band |
Frequency, GHz |
Wavelength, cm |
Satellite systems |
|
X |
5.2–10.9 |
2.75–5.77 (2.4–3.8) |
Iceye |
|
C |
3.9–6.2 |
3.8–7.6 |
|
|
L |
0.39–1.55 |
19.3–76.9 (15–30) |
SIR-A,B JERS |
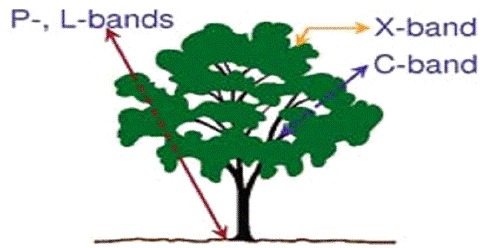
The principle of operation of a radar satellite: the spacecraft sends a radar signal in the microwave range, which reaches the Earth's surface and is reflected from it, as well as partially penetrating inside. The radio signal can penetrate to a depth equal to half the wavelength. The intensity of the reflected signal is determined by the surface properties (roughness, moisture, orientation in space, slope steepness, dielectric constant, etc.) and the wavelength of the radiation, so different ranges of imaging are suitable for different tasks (Fig. 1). After this, the reflected signal returns to the satellite and is recorded.
Fig. 1 Comparison of Radar Beam Incidence in Different Bands
Radar imaging has many applications in various fields such as forestry and agriculture, oceanography, urban planning, transportation infrastructure, and especially in the extractive industry, including the oil and gas sector.
Radar imaging has many applications in various fields such as forestry and agriculture, oceanography, urban planning, transportation infrastructure, and especially in the extractive industry, including the oil and gas sector.
Application of Radar Imaging in the Oil and Gas Industry:
- Creation and updating of topographic maps of various scales, inventory of objects in production areas, and protective zones. This is especially relevant for regions with prolonged cloud cover, such as the Far East.
- Monitoring of oil spills in marine areas. An oil spill represents a thin film that differs in texture and structure from water. In radar images, oil spills are distinguished by:
- Regular and simple geometric shape;
- Smoothed boundaries with a slightly larger gradient than natural covers;
- Small size (large spots are usually natural covers, such as algae or plankton clusters).
- Terrain analysis. Radar imaging essentially scans the area, and the data obtained can be used to create a digital model of the terrain and relief.
- Monitoring surface displacement using interferometric processing of radar imaging. Interferometric measurements are conducted using pairs of images of the same area, taken at different sensor positions and at different times. Such pairs are formed using a repeat pass cycle over the area. SSC data is required to obtain information about the intensity and phase of the radiation. Displacement values are determined by calculating the difference between reflection points in the images. Measurement accuracy can be less than a millimeter. Interferometric methods (INSAR — Interferometric Synthetic Aperture Radar) can only be used with good similarity of paired images.
Radar Interferometry is also applicable in other human activities:
- In urban planning, radar interferometry can determine the level of displacement of buildings and slopes.
- In the extractive industry, constant monitoring of the terrain is conducted to avoid dangerous situations. In mining areas, surface subsidence often occurs due to the formation of cavities inside.
Operation mode:
Mon-Fri: 10:00 - 18:00
Sat-Sun: Non-working days