An overview of digital elevation and terrain models. Available free of charge
An overview of digital elevation and terrain models. Available free of charge
01
What is the benefit of this article?
What Is the Practical Value of This Article?
By reading this article, users will learn about the different types of digital elevation models (DEMs) and digital terrain models (DTMs) that are available, the area covered by each dataset, which DEMs are available as open data, and which can be ordered commercially.
02
Introduction
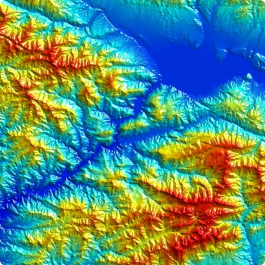
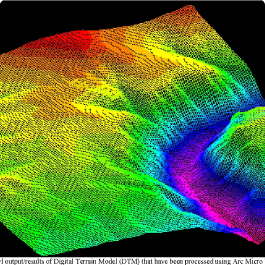
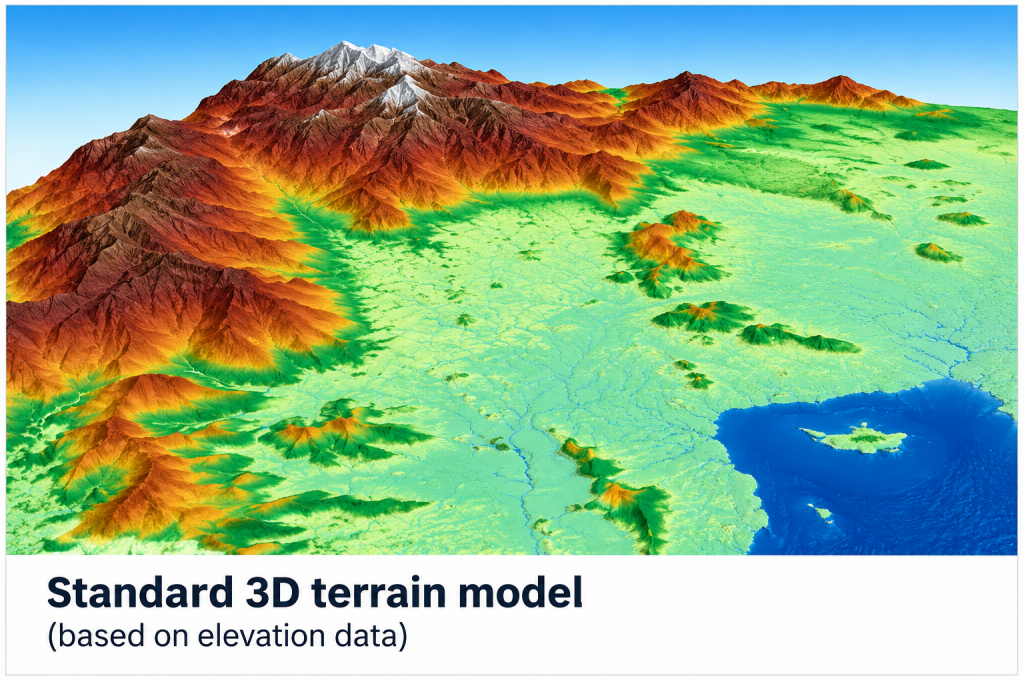
Digital elevation models (DEMs) are a type of three-dimensional mathematical model containing information about the elevation of the Earth’s surface.
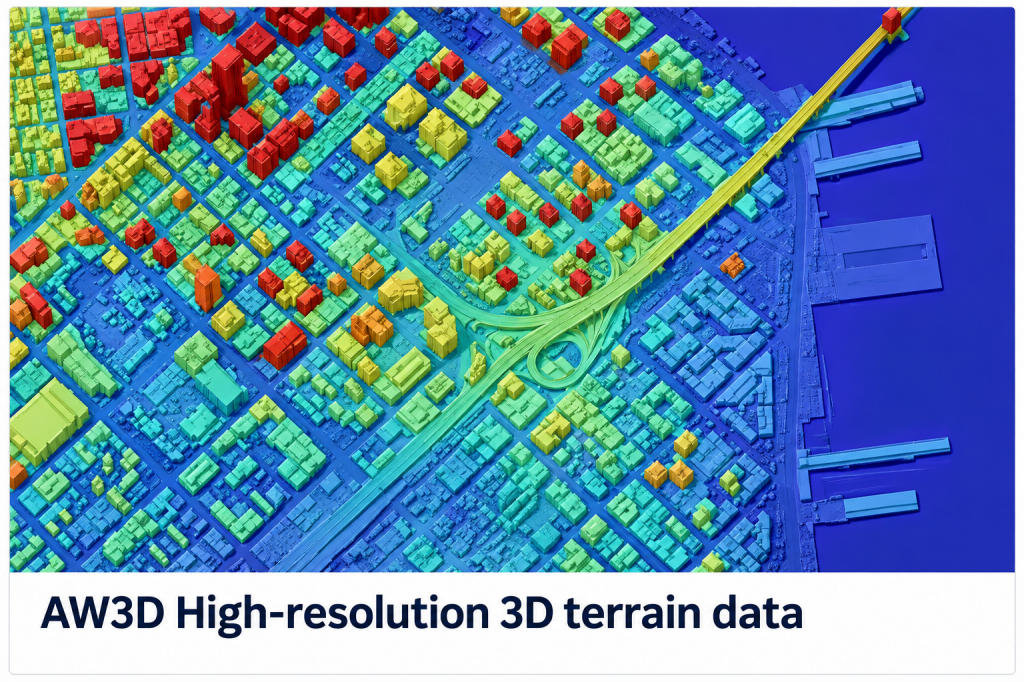
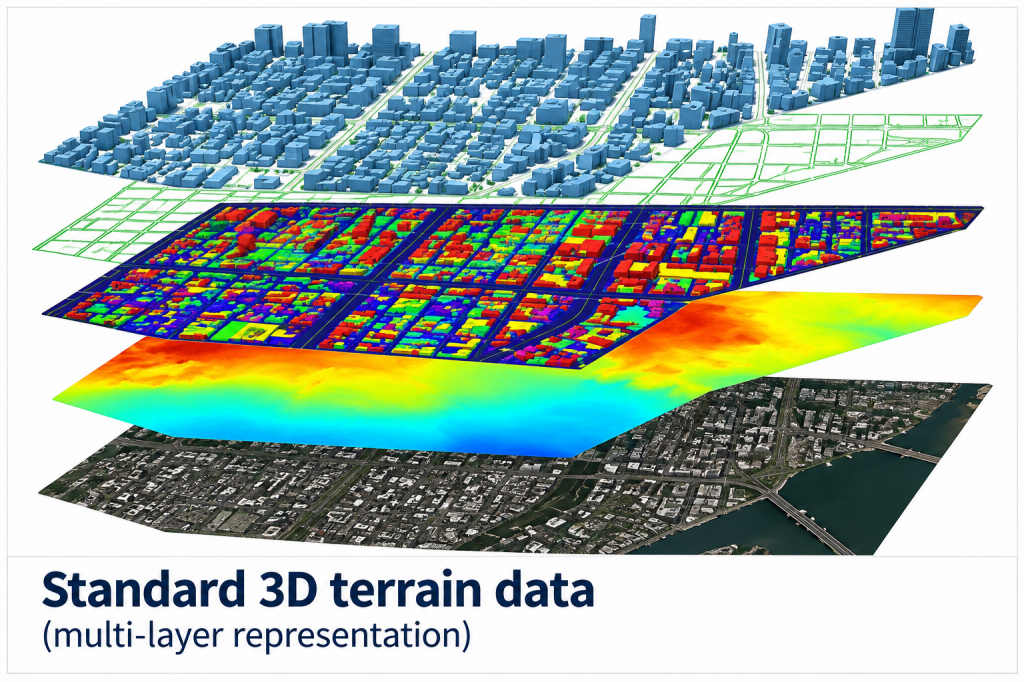
It is important to distinguish between a digital surface model (DSM), which represents terrain together with man-made objects and elevated natural features, and a digital terrain model (DTM), which represents only the underlying bare-earth surface.
Figure 1. DSM and DTM
In geodesy, photogrammetry, and non-spatial disciplines, the terms DSM, DTM, DEM, DSM, and DTM are often confused.
For a simple understanding of how these terms are used in different fields, the distinctions can be summarized in the table below.
Term
Photogrammetry
Geodesy
Geospatial / GIS
DSM
Often used to mean DSM (what is measured from a stereo pair), or a complex map combining 2D information with elevation.
A broad concept covering terrain and surface features. Rarely used as a standalone term.
Often used broadly for elevation data stored in GeoTIFF format.
DSM
A primary product generated automatically from point clouds and rasterized with trees, buildings, and other above-ground objects.
Rarely used in engineering surveys because above-ground objects can interfere with design work.
Used for terrain shading, line-of-sight and radio visibility calculations,
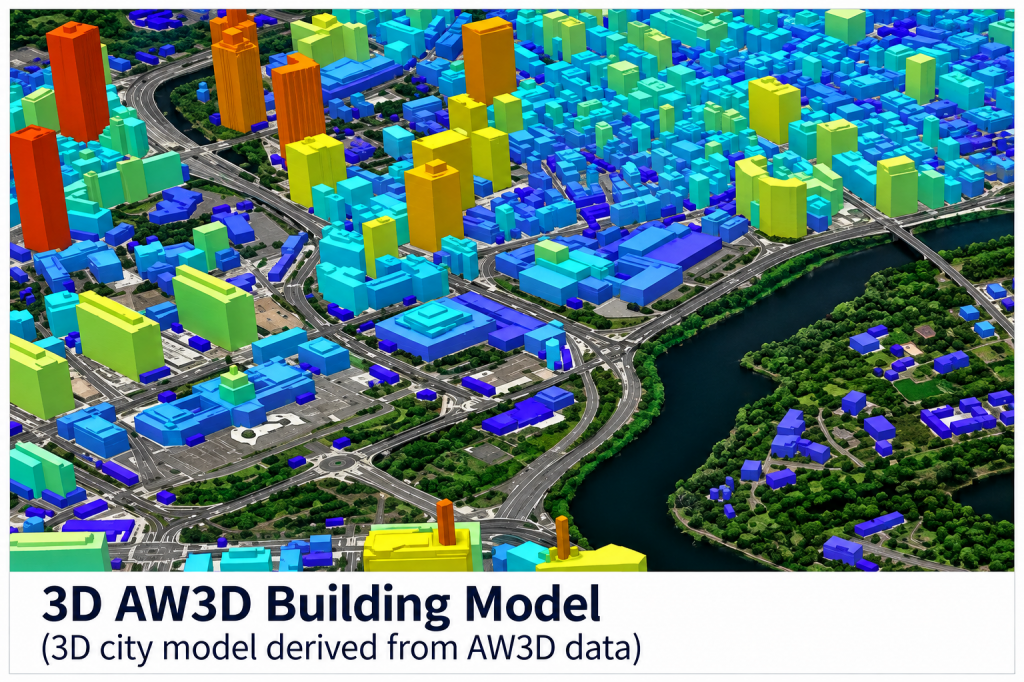
and 3D city modeling.
DTM
Requires complex filtering to remove forests and buildings — this is typically performed during post-processing, for example with LiDAR data, rather than directly in photogrammetry.
A key concept. Formally established in professional standards.
Used in bathymetry, geology, and soil science.
In technical specifications, it is always necessary to clarify:
Whether elevations are required for the bare ground only. In that case, LiDAR or field surveys should be used, because aerial photogrammetry typically produces a DSM.
If photogrammetry is used and the report is prepared in Russian, it is better to write “DSM (elevation raster including surface objects),” while the term “DTM” should be reserved for a filtered bare-earth model.
However, the ultimate objective of the entire DEM + DSM + DTM technological chain is to create a realistic 3D model for any location on Earth with the required parameters — a model that is visually indistinguishable from what the human eye perceives, while being enhanced by technical sensors to capture biological, chemical, physical, structural, natural and man-made, and phenomenological properties of our planet.
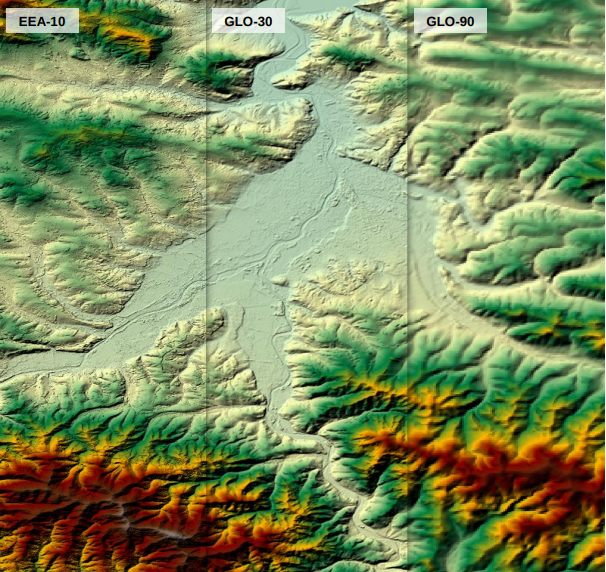
Grid spacing: 30 m (global coverage except Azerbaijan and Armenia), 90 m
Coverage area: from 50° north latitude to 50° south latitude.
Acquisition period: 2011–2025.
04
Local CMRs
Local DEMs
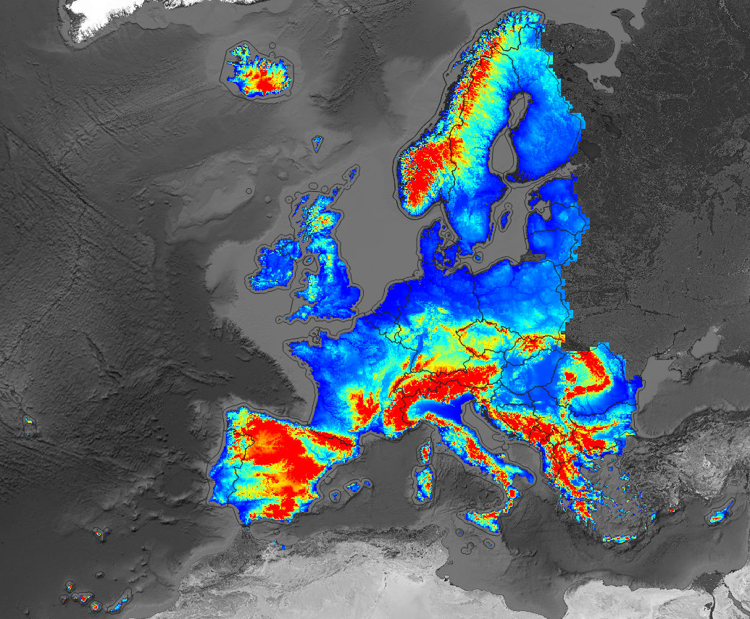
In addition to global DEMs, local and regional elevation models are continuously being created and generally offer higher accuracy. Development follows two main paths: through commercial providers, or through websites that provide software for independent processing, including cloud-based processing. In the latter case, payment is usually required only for the primary source data, such as satellite imagery. Licensed provider companies either produce DEMs themselves or offer ready-made products. Let us consider some of them:
Coverage area: from the Tien Shan to the eastern Himalayas
Acquisition period: 2002–2016.
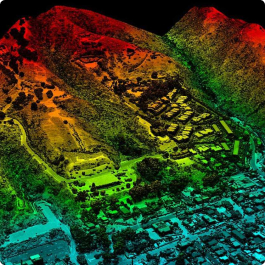
Figure 7. Fragment of the Himalayan DSM
7. Vantor DTM/DSM/3D
Among the most up-to-date and high-accuracy products, available by subscription.
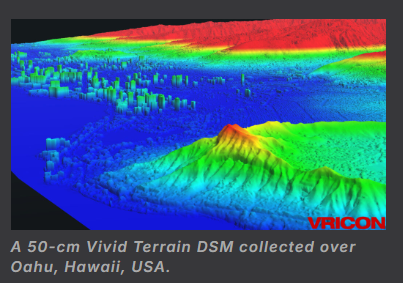
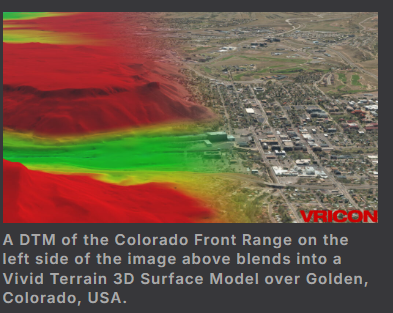
Vantor Geospatial Platform (MGP) Pro, formerly known as SecureWatch, is a subscription-based cloud platform providing on-demand access to global Earth information. In addition to imagery, it provides access to digital models and related products through Precision 3D / Vivid Terrain DEM data.
Precision3D Data Suite:
3D surface model, digital surface model (DSM) with 5 cm resolution,
digital terrain model (DTM) with 5 cm resolution, point cloud,
buildings. Grid products for regions at 30×30×50 cm / 50×50×100 cm.
DEM Post Distance (resolution):
50 cm (primary product).
Absolute vertical accuracy: <3 m Linear Error 90% (LE90).
Absolute horizontal accuracy: <3 m Circular Error 90% (CE90).
Product levels: DSM and DTM.
Acquisition date: archive data + 2026.
8. RESTEC
RESTEC is a Japanese Earth observation technology center. The center receives and processes data acquired by both domestic satellites such as ALOS and foreign Earth observation satellites, as well as airborne and ground-based sensors, providing processed data to researchers and operational users, primarily under contracts with the Japan Aerospace Exploration Agency (JAXA), NTT DATA, and other organizations.
Product Type
DSM/DTM
Resolution
2.5 m / 5 m
Satellite
JAXA-ALOS
Coverage
Global
Horizontal accuracy
5 m RMSE / 7 m CE90
May vary depending on terrain characteristics.
Vertical accuracy
5 m RMSE / 7 m LE90
May vary depending on terrain characteristics.
Minimum order size
400 km2
Delivery formats
GeoTIFF; other formats available upon request.
Delivery method
Online or physical media (DVD)
Panchromatic ortho (2.5 m resolution)
Additional services*
- Color ortho (2.5 m resolution)
- File / Layer quality control
*Format conversion service for 3D printers into STL format
In the DEM field, the center offers four product options:
9. APOLLOMAPPING
A provider based in Chicago, Illinois, USA, specializing in streamlining the acquisition of geospatial products and providing guidance through the Image Hunter User Guide. It offers a search engine containing more than 200 million images and more than 60 datasets, including satellite imagery, aerial photography, and digital elevation models (DEMs), from companies such as VANTOR, Airbus Defence, Planet Labs, SpaceWill, including Jilin-1 (GF/KF/Optical/Video series, as well as nighttime and video products), SuperView Neo-3, ZiYuan-3 (mono and stereo), and others.
Elevation models are usually provided in two formats:
As a raster grid, where each pixel has a known ground position, for example 1 m × 1 m, with a corresponding elevation value, for example 525 m. This is the most commonly used data format.
As a vector file containing continuous lines or contours at a specified interval, for example every 5 m, with corresponding elevation values, for example 110 m.
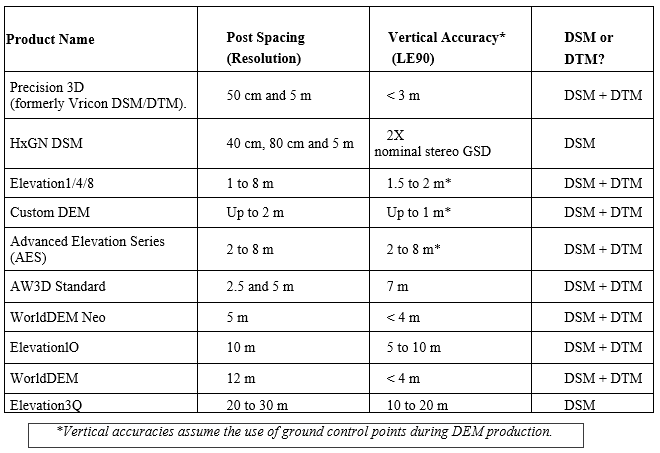
The table below presents the main characteristics of the elevation models offered by the company:
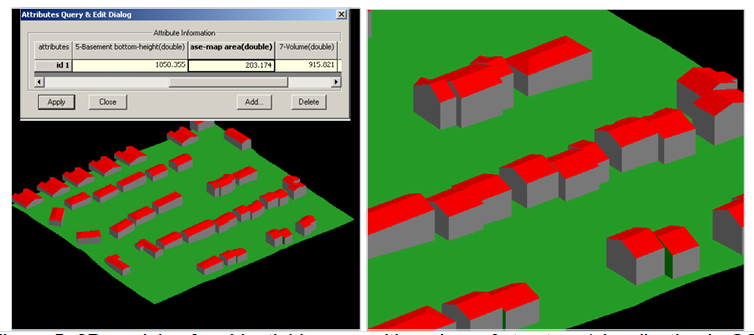
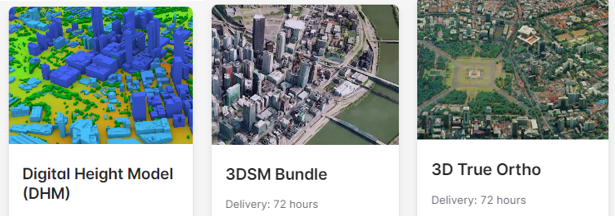
The company also provides high-quality solutions for building-related DSM applications.
Geometric building parameters such as height, volume, area, and facade inclination angle are calculated automatically.
3D models of residential buildings with primary roof structures, visualized in CC-Edit, and automatically calculated geometric characteristics
10. SkyFi
SkyFi is a U.S. technology company that has created a platform for simplified access to satellite imagery, standardized derived products, including various DEM options, and AI-based analytics. In simple terms, it is a “marketplace” or “virtual constellation” that allows users to order satellite imagery almost as easily as ordering a pizza through an app.
It is a platform for ordering satellite imagery and geospatial analytics, also referred to as an Earth Intelligence Platform. It does not operate its own satellites, but aggregates data from more than 50 partners, including optical, SAR, and hyperspectral providers. SkyFi works with leading operators such as Vantor, Planet,ICEYE, and the Chinese company SIWEI.
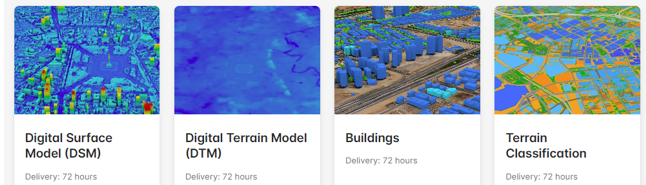
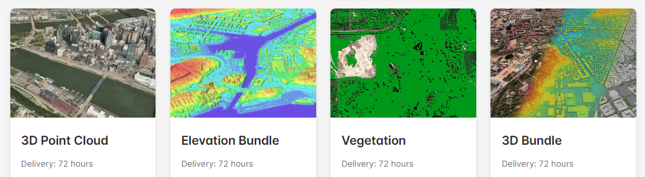
Eleven products are presented, demonstrating nearly all currently available approaches to source digital modeling, from satellite imagery with spatial resolution of approximately 15–50 cm/pixel, through high-accuracy airborne and LiDAR-based processing with resolution down to 1–3 cm/pixel, as well as 360-degree video products:
11. Felt
Felt (Oakland, CA, USA) is a cloud-based GIS platform that allows users to create maps, applications, and dashboards within seconds. Whether working in urban planning, environmental science, real estate, or logistics, Felt provides organizations with advanced spatial capabilities.
In particular, this cloud platform enables step-by-step DEM creation.
The abbreviations DTM, DEM, and DSM refer to different types of elevation models, each representing a different version of the Earth’s surface. All three store elevation values digitally, typically as raster grids, but differ in the type of surface they represent.
Important note. Working with DEMs appears simple until processing begins at large scale. Elevation datasets are often very large raster files requiring significant amounts of memory, storage, and computing power. High-resolution terrain data can slow rendering and overload desktop computers, forcing teams to clip or downsample files in order to accelerate project workflows.
DEM-related workflows are summarized in the table below:
Parameter
DEM
DSM
DTM
Surface representation
General elevation grid
“Bare earth” or surface, depending on the dataset
Represents the upper surface including above-ground features
“Bare terrain” with surface features removed
Vegetation
and buildings
Depends on the dataset
Yes
No
Data structure
and complexity
Raster grid based on elevation values
Raster generated from first-return LiDAR or photogrammetry
Raster generated from a classified point cloud with ground points filtered and retained
Typical data sources
LiDAR, photogrammetry, satellite stereo
LiDAR (first return), photogrammetry
LiDAR (ground returns), photogrammetry with filtering
Accuracy and suitability
Depends on resolution and processing; suitable for general terrain analysis
High level of detail for surface features such as trees and structures
High accuracy for ground-based analysis such as slope assessment and hydrology
GIS applications
Regional elevation mapping, terrain visualization
Urban modeling, line-of-sight analysis, solar studies, building height assessment
Hydrology, flood modeling, drainage networks, slope and contour analysis
Processing and maintenance
Minimal processing when pre-processed data are used
Moderate processing; updates may be required as urban conditions change
Higher processing requirements due to ground classification and filtering
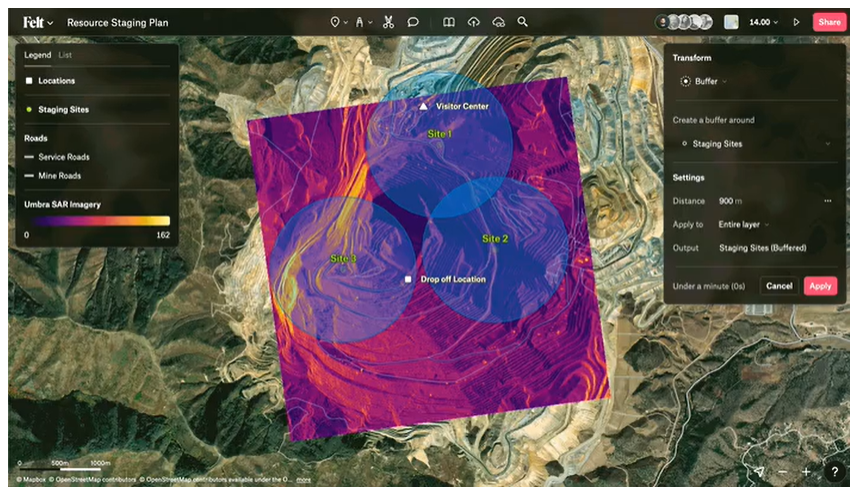
Example of independent DEM creation through the Felt cloud platform:
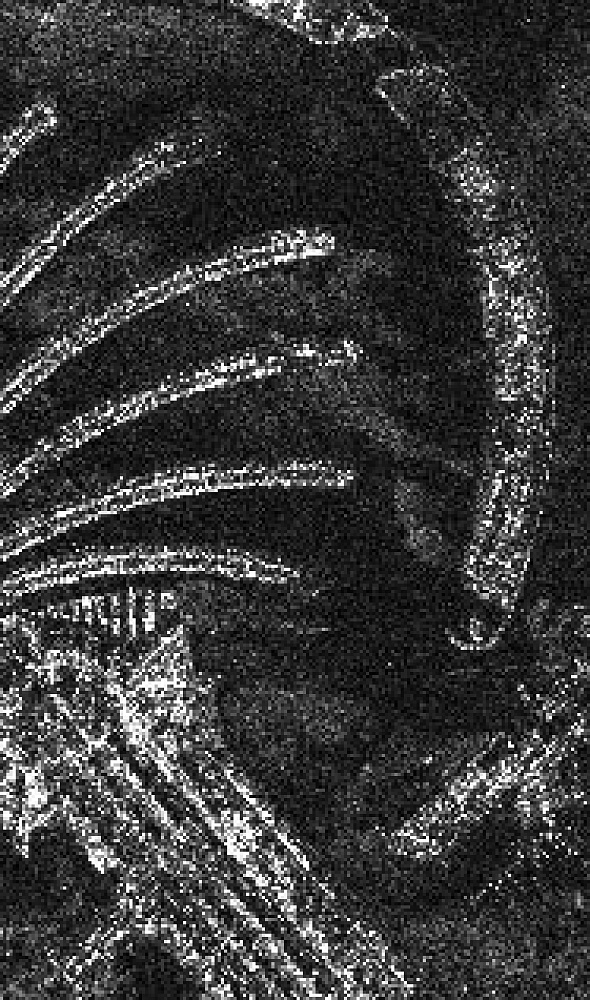
DEM derived from Umbra SAR satellite imagery overlaid on a Google Earth geospatial base
Generalized capabilities for creating DTM/DSM products are summarized in the table below:
Characteristic
Satellites
UAVs (Drone)
Terrestrial LiDAR
Typical accuracy
(vertical, Z)
1–3 meters (RMSE)
High-accuracy commercial imagery may reach approximately 0.5 m, while corrected open datasets, for example ArcticDEM, may achieve RMSE values as low as 0.20 m
Centimeter-level
(0.05–0.15 m)
Typical error for UAV LiDAR is approximately 0.10–0.11 m. Photogrammetry based only on imagery is generally less accurate, around 0.30 m
Millimeter-level
(±0.01 m and better)
Provides maximum detail and accuracy for small areas. Often used as reference data
Spatial resolution / point density
Low / Medium
Image resolution (GSD): from approximately 0.5 m for commercial data to 10–30 m for free datasets. Correspondingly, point density per m² is relatively low
Very high
GSD may be on the order of a few centimeters. Point-cloud density can reach 200–1000+ points/m² when acquired from low altitude
Maximum
Can provide millions of points per m² when scanning from multiple positions
Ability to “see” the ground (DTM)
Limited / Often impossible
Standard optical imagery records the tops of surface objects, producing a DSM. A clean terrain model can generally be obtained only in completely open terrain
Good (for LiDAR)
Laser pulses can partially penetrate tree canopies because multiple returns are recorded, with the last return often corresponding to the ground
Outstanding
Scanning from different angles makes it possible to capture areas beneath bridges, inside caves, and behind vegetation, making it ideal for architecture and complex engineering structures
Coverage area
per acquisition
Very large (thousands of km²)
Makes it possible to create models for entire countries and continents. Ideal for regional analysis
Local (0.5–10 km²)
Depends on UAV type, such as multirotor or fixed-wing. Ideal for quarries, road corridors, settlements, and similar sites
Site-specific (hundreds of m²)
Used for scanning individual buildings, bridges, road sections, and archaeological sites
05
Conclusion
This article presents a selection of digital elevation models currently available. New DEMs are continuously being developed, while existing datasets are updated using new technologies, including AI-based methods for converting DSMs into DTMs. Today, geospatial products based on imagery and elevation models represent a major technological leap in terms of the balance between cost, time, and quality across key sectors of the economy and environmental sciences in the world’s leading countries. This is an established reality rather than an attempt by providers to promote a product without genuine demand. Naturally, not every company can afford to maintain an in-house team with sufficient geospatial expertise, especially given the limited number of qualified specialists in the industry.
We expand project capabilities with additional data and imaging types. We will select the right source — from satellite and aerial imagery to LiDAR and radar materials — for your territory, timeline, and task.
Need satellite imagery or help choosing the right data?
Describe your task, area of interest, and desired outcome. We will check data
availability, assess new acquisition options, and propose the optimal solution in terms of timelines, cost,
and quality.
Fast feedback during business hours
We will select the best data for your task
Confidentiality guaranteed
Discuss the project
clients who trust us
25+ years in the geodata market
Need satellite imagery or help choosing the right data?
Describe your task, area of interest, and desired outcome. We will check data
availability, assess new acquisition options, and propose the optimal solution in terms of timelines, cost,
and quality.
Fast feedback during business hours
We will select the best data for your task
Confidentiality guaranteed
Discuss the project
clients who trust us
25+ years in the geodata market
Мы используем Яндекс.Метрика и собственные Сookies для обеспечения наилучшего
опыта работы на нашем сайте, персонализации сайта для наших пользователей и аналитики.
Продолжая использовать сайт вы соглашаетесь с условиями
Пользовательского соглашения.
Request a call
Leave your contact details — we will get back to you during business hours, clarify the task and suggest suitable data or services.
Write to e-mail
Send a message, technical specification or task description. We will review your request and reply to the specified e-mail.
Fill in the order form
Describe the area, object and imagery requirements. We will check archive availability, the possibility of a new acquisition and offer a suitable option.



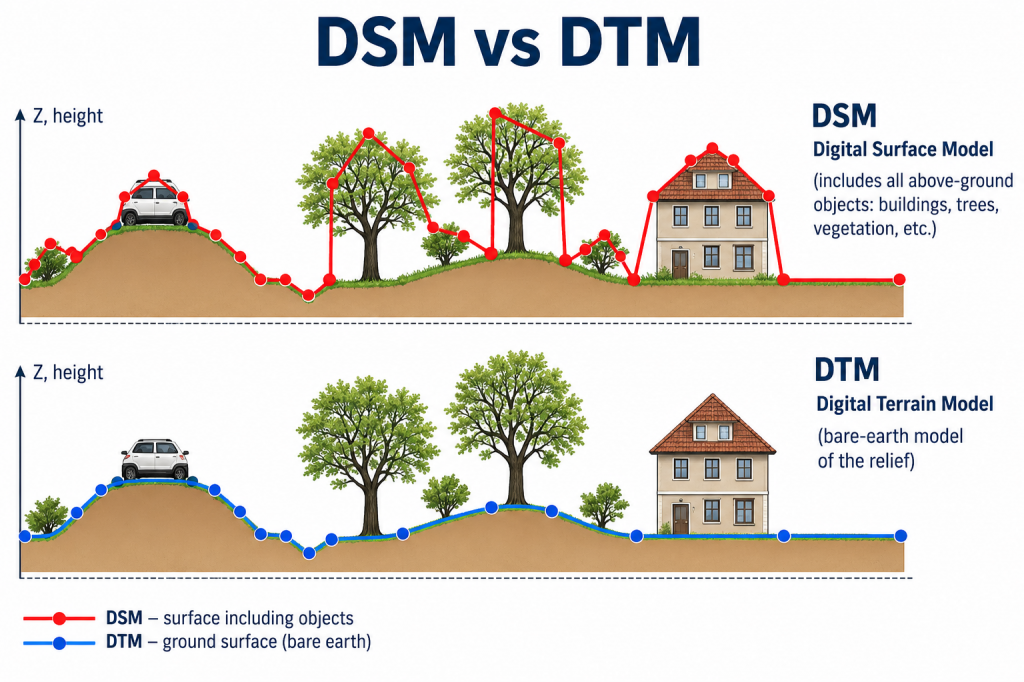 Figure 1. DSM and DTM