You can order from us
Prices for services
| Consultation | Free of charge |
|---|---|
| Preliminary analysis | Free of charge |
| Aerospace imaging | The cost of remote sensing materials is calculated individually for each order and may vary: minimum cost from $0.5 per 1 km2. |
| Execution time | New imaging takes from 5 working days from the moment of prepayment. The execution time may be extended for significant areas and specific climate conditions of the area of interest. Delivery of archive data within 3 days. |
The cost of satellite imaging depends on the area of the site, quality requirements, and the type of final material - orthophoto, DTM, DSM, 3D model, the need for thematic processing, etc., and is calculated individually for each customer.
The cost of execution is calculated on an individual basis, taking into account a specific of task.
After receiving the task description, we calculate the cost and send you a commercial offer.
Period of execution
Alignment of requirements for remote sensing materials: from 1 to 5 days*
Contract conclusion: from 1 to 5 days*
Ordering of the imaging (task assignment to the spacecraft operator): from 5 days**
Obtaining archive remote sensing materials: from 3 days**
Thematic processing of remote sensing materials (if necessary): from 15 days*
TOTAL TIME: from 15 days
* working days
** from the date of receiving 100% advance payment
The deadlines for satellite imaging depend on the total area of the territory, imaging parameters, the final product required, and are calculated individually for each customer.
How to place an order:
Need for consultation?
Fill the form and we will contact you
Stages of service provision
The result of the provision of services
Creation of the final product based on imaging materials:
- Archived images of various types: black and white, color, multi-zone, synthesized for the monitoring period, according to the Client's Technical Task.
- Materials of new imaging of various types.
- Thematic LULC maps (Land Use and Land Cover).
- Results of LULC analysis in agreed indices and formats.
GEO INNOTER delivers to the Customer who requested the imaging materials, the finished product according to the Technical Task on electronic media or via the Internet through FTP servers.
Requirements for Source Data
Precise coordinates of the area of interest, precise requirements for remote sensing materials (resolution on the ground, type of imaging, maximum angle of image tilt, minimum angle of the sun, imaging period), additional requirements for the final product (if necessary), output data formats.
If it is not possible to provide the specified information, provide information about the purposes for which the remote sensing materials will be used, and GEO INNOTER specialists will analyze the requirements and propose an optimal solution.
Related services


Completed projects
Customers
FAQ
Geometric data is a type of spatial data displayed on a flat two-dimensional surface. An example of this could be the geometric data found in floor plans. Google Maps is an application that utilizes geometric data to determine precise directions. In fact, this is one of the simplest examples of spatial data usage in action.
Geographic Referencing and Geocoding
Similar processes, geographic referencing, and geocoding are important aspects of geospatial analysis. Both geocoding and geographic referencing involve aligning data to the real world using appropriate coordinates, but the similarity ends there.
Geographic referencing focuses on assigning coordinates to vector or raster data, helping accurately model the Earth's surface.
Photogrammetry uses visualization rather than collecting data on the wavelength of light. It involves determining the spatial properties and dimensions of objects captured in digital photographs.
Vector and raster (Fig. 1) are common data formats used for storing geospatial data.
Vectors are a graphic representation of the real world. There are three main types of vector data: points, lines, and polygons. Points help create lines, and connecting lines form closed areas or polygons. Vectors often represent the generalization of features or objects on the Earth's surface. For example, vector data (used by over 78% of users) is stored in shapefiles, sometimes referred to as shp files (used in ArcGIS software).
Raster represents information presented in a grid of pixels. Each pixel stored in the raster has a value. This value can be anything from a measurement unit, color, or information about a specific element. Typically, raster refers to images, but in spatial analysis, it often refers to orthoimages or satellite images taken and preprocessed from aerial devices or satellites.
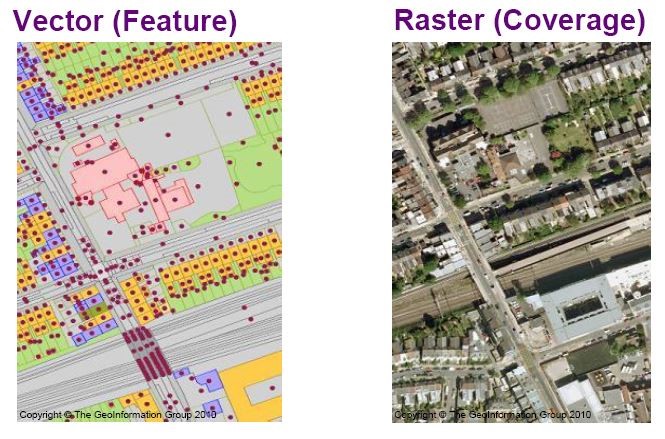
Fig. 1.
There is also something called an attribute. Whenever spatial data contains additional information or non-spatial data, they are referred to as attributes. Spatial data can have any number of location attributes. For example, this could be a map, photographs, historical references, or anything else deemed necessary.
The field of spatial data technology focuses on extracting a deeper understanding from data using a complete set of spatial algorithms and analytical methods. Modern methods include the use of machine learning and deep learning to uncover hidden patterns in data, improving predictive models.
Spatial data can also include attributes that provide additional information about the object they represent. This helps users understand where things are happening and why. Geographic Information Systems (GIS) and other specialized software applications help access, visualize, manipulate, and engage in spatial analysis.
Experts expect spatial data science to become more important as government agencies and businesses seek to make more informed decisions based on data.
Other aspects of spatial data science include spatial data analytics and data visualization.
Spatial data analytics involves the process of discovering hidden patterns in large spatial datasets. As a key factor in GIS application development, spatial data analytics allows users and geospatial professionals to extract valuable data about neighboring regions and explore spatial patterns. In this scenario, spatial variables such as distance and direction are taken into account.
Data visualization software allows various spatial data files to be connected in geospatial technology, such as Esri File geodatabases in ArcGIS, GeoJSON files, Keyhole Markup Language (KML) files, MapInfo tables, shapefiles, TopoJSON files, etc.
After connecting, GIS specialists or users can create maps of points, lines, and polygons using information from spatial data files, LiDAR data files, and geospatial data files.
Over the past 20 years, spatial data has been used not only for cartography (the share of map creation based on remote sensing data was 60% in 2021, compared to 95% in 2000) but also for new areas such as BIM, SMART, IoT, OutDoor/InDoor.
Navigational and mobile technologies form the foundational basis for spatial data. For example, popular mobile applications allow data developers to create complex integrated applications using sets of geospatial and temporal data from IoT data, maps, weather data, UAVs, satellites, etc.
Today, spatial data plays a leading role in managing and selecting the necessary information components in the BIG DATA environment, machine reading ("artificial intelligence"), neural network analysis, and other promising fields of science and IT technologies.
In practice, the ecosystem of human habitation and development is connected with spatial data - land, water, ocean, atmosphere, nature, resources, cities, roads, any infrastructure, social, political, and military interactions.
The quality and technical characteristics of sensors, as well as the conditions for Earth remote sensing, are determined based on their spatial, spectral, radiometric, and temporal resolution (sampling frequencies), which are defined by the task of processing data and obtaining the final product or service of remote sensing (RS). The Client's tasks determine the choice of sensor data characteristics.
Spatial Resolution
The size of a pixel recorded in a raster image. Usually, pixels can correspond to square areas with sides ranging from 0.15 to 1000 meters.
The ability to capture the Earth's surface in one pixel, for example, of satellite sensors, is called spatial resolution (commonly referred to as geometric resolution on the Earth's surface). In some cases, spatial resolution depends on the orbit on which the spacecraft flies.
Currently, great attention is paid to increasing the spatial resolution of satellite sensors. It reaches 15-25 cm. Increasing spatial resolution improves the quality of images.
Aerial and UAVs have a resolution of up to 3-5 cm, while ground lidar surveys have a resolution of up to 3-5 mm.
Visual comparative images to understand spatial resolution are shown in figures 2, 3, 4, 5.
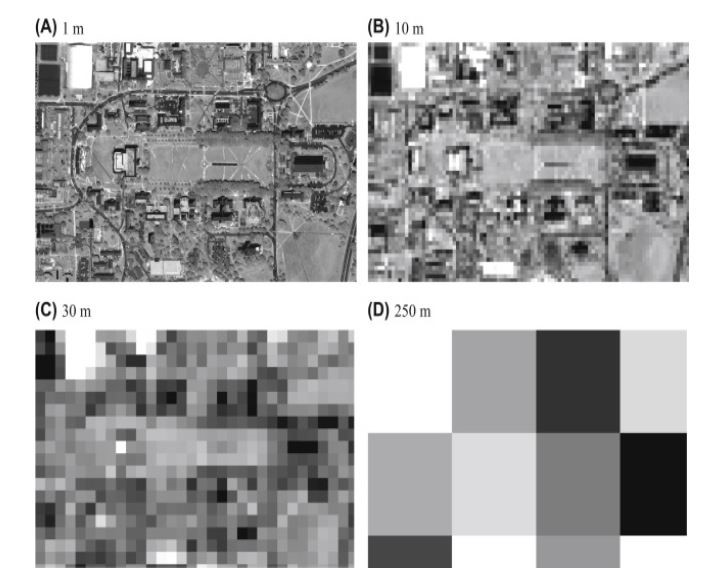
Figure 2 Satellite Sensors
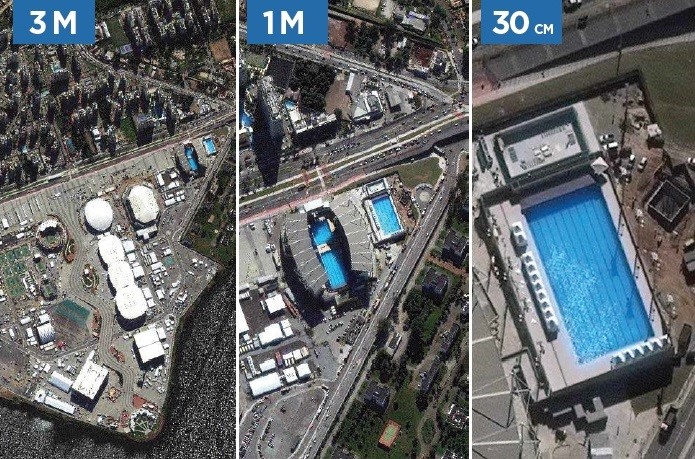
Figure 3 Satellite Sensors
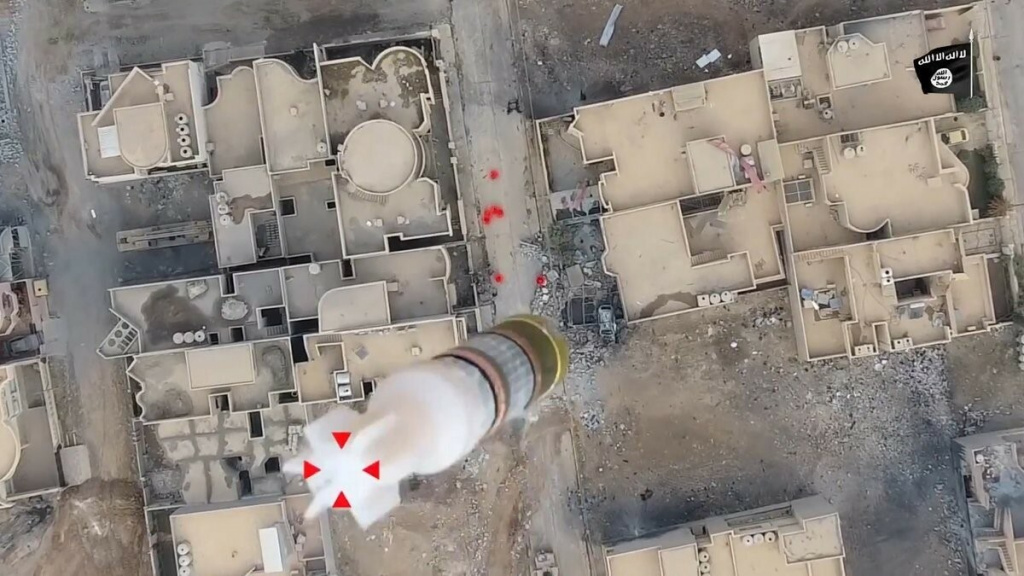
Figure 4 UAV Sensors (Resolution on the Ground 3-5 cm)

Figure 5 Comparative Image from Satellite and UAV
Spectral Resolution
The wavelength of various recorded frequency ranges - usually associated with the number of frequency ranges of the electromagnetic spectrum recorded by the sensor platform (Figure 6).
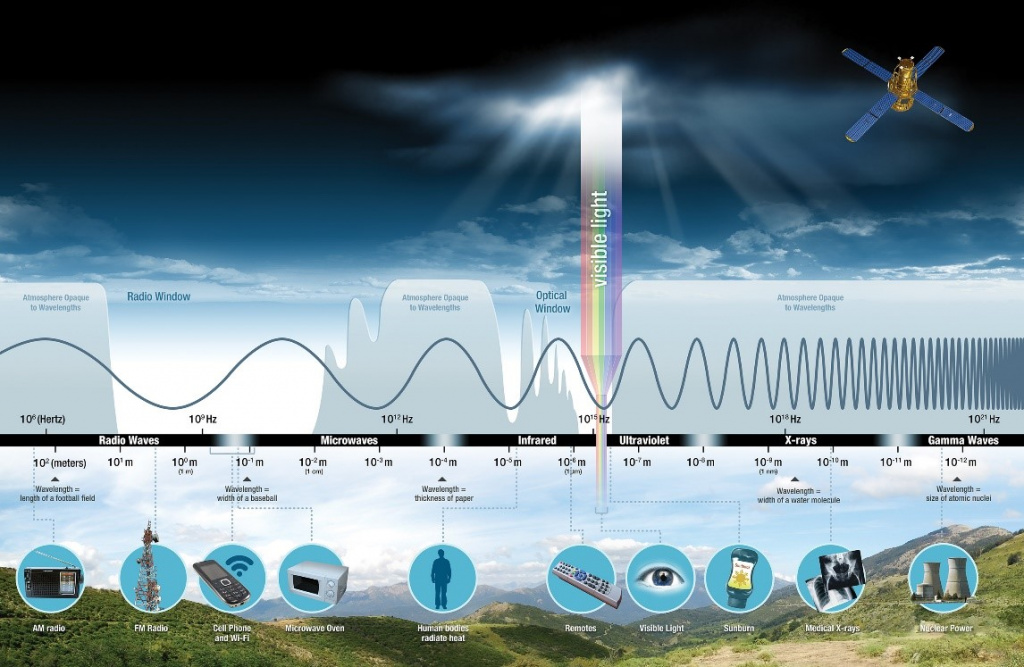
Figure 6
Spectral resolution is a characteristic of a sensor that captures images in different wavelengths of the spectrum. Currently, in modern remote sensing, panchromatic, multispectral (Figure 7), hyperspectral, and super-spectral images based on this characteristic are used. Different objects reflect rays in different wavelengths. Therefore, to determine any characteristic of an object, its reflective properties in different wavelengths of the spectrum must be studied. For example, to use an image as a background, it is sufficient to have its image taken in three spectral ranges: green, blue, and red (RGB).
However, if we want to obtain more data from it, such as expressing impermeable surfaces or vegetation classification, we need to use the near-infrared (NIR) or thermal infrared (IR) range. In this case, the possibilities of the MODIS scanner are not limited . It takes images in 36 spectra in the wavelength range from 0.4 µm to 14.4 µm and transmits them to Earth. The more ranges, the easier it is to identify an object. In this regard, the Landsat 8 and 9 satellite scanner takes second place. Its spectral image is taken in 10 ranges (coastal, blue, green, red, NIR, SWIR1, SWIR2, Pan, TIR1, TIR2). If we consider the water vapor Cirus identifier as one band, the number of Landsat 8 OLI TIRS bands will reach 11 bands. The thing is, the Cirus band does not capture images in the visible wavelength range but operates according to the function of light-returning oncoming aerosols. The last place is occupied by the WorldView2 and WorldView3 satellites. The sensors of these satellites provide us with images in 9 spectral wavelength ranges. These ranges are Coastal, Blue, Green, Yellow, Red, RedEdge, NIR1, NIR2, and Pan. In this regard, MODIS satellite scanners received high ratings. However, due to poor spatial resolution, it is not widely used.
Therefore, currently, the highest demand is for data from the WV3 satellite. Especially its extended red range.
Thematic solutions for space data create the majority of RS products based precisely on WV3 images.
The conditions for the normal operation of sensors, i.e., obtaining high-quality images, are determined by the atmospheric transparency windows that allow passing a specified portion of the sensor's electromagnetic spectrum.
Spectral characteristics and transparency windows for RS sensors are presented in figure 8.
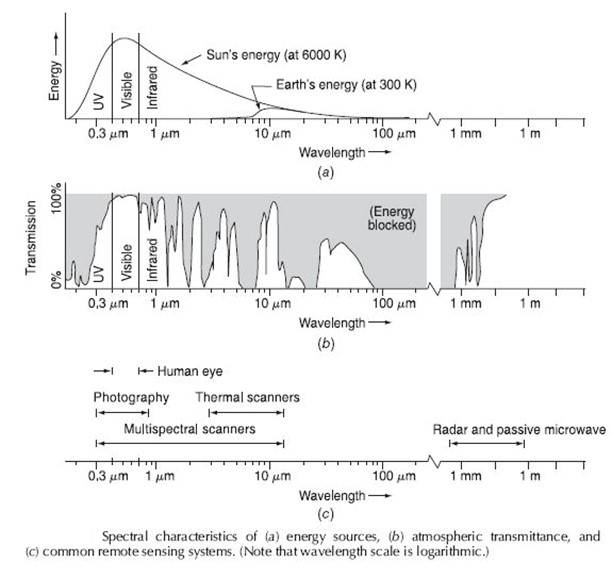
Figure 8
Radiometric Resolution
The number of different radiation intensities that the sensor can distinguish. Usually, this ranges from 8 to 14 bits, which corresponds to 256 levels of gray scale and up to 16,384 intensities or "shades" of color in each band. This also depends on the sensor's "noise."
The difference in radiometric resolution can be illustrated easily using Figure 9.
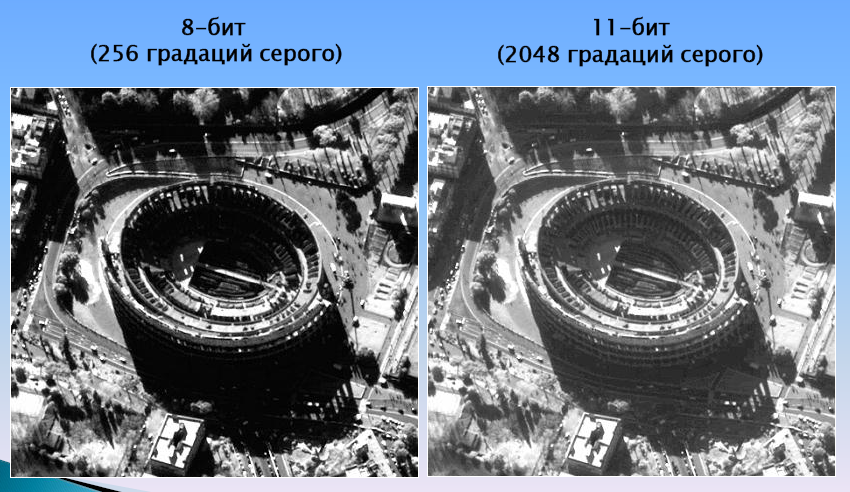
Figure 9
Temporal Resolution
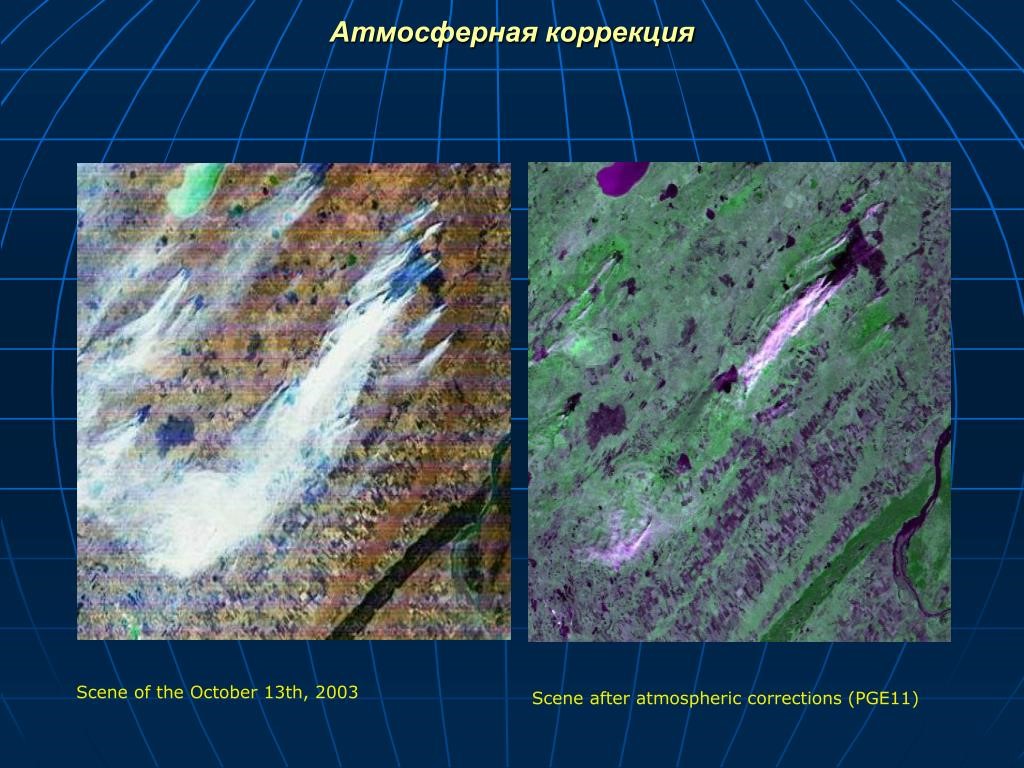
The frequency of satellite or aircraft (UAV) passes and imaging over the same territory or observation target. It is of great importance for temporal data series research in RS when monitoring processes (agriculture, construction, military affairs, water resources, emergencies, etc.). For example, the temporal resolution of RS satellites today in military affairs reaches up to 15 minutes, and in civilian applications, it can be 1-2 hours, and seasonal resolution can be annual (archive data). Archive data for in-depth research of territory changes can be ten years old (Figure 10, 11).
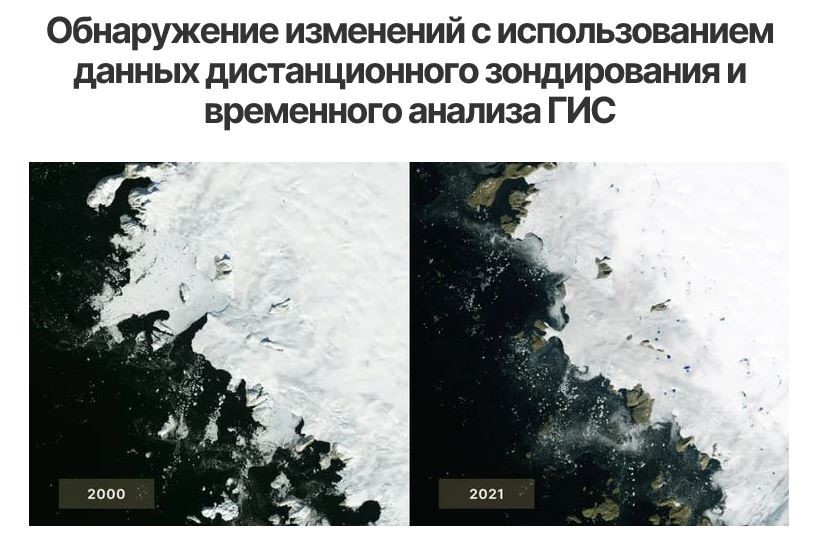
Figure 10
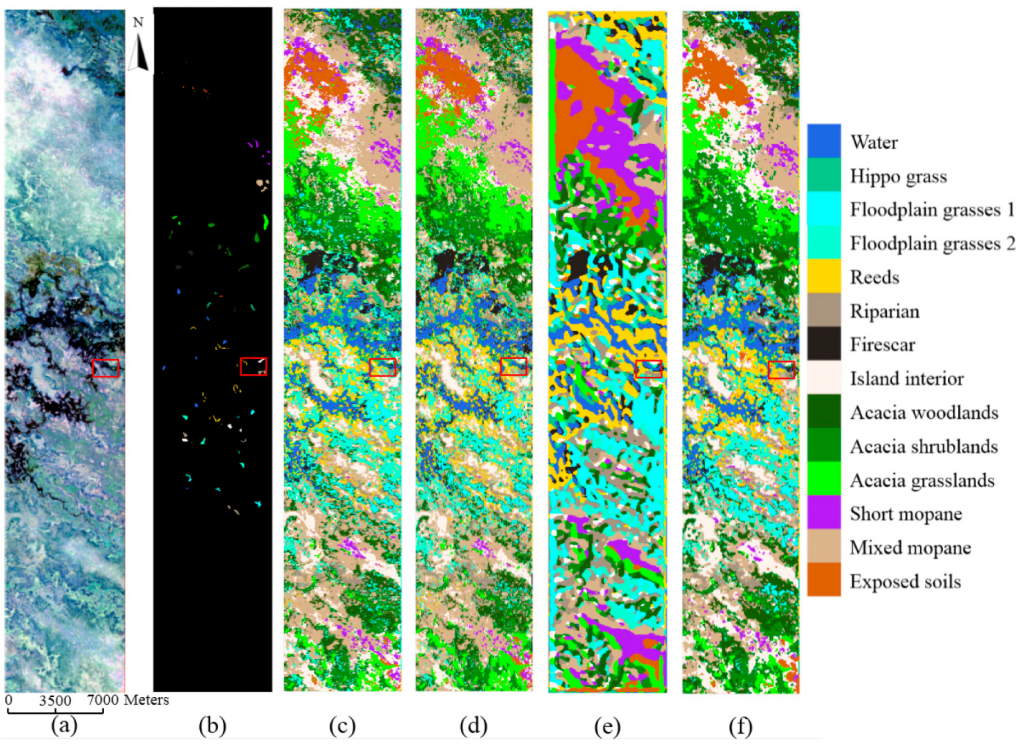
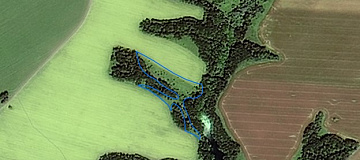
Figure 11 Changes in Cropland State During the Year (LULC Technology)


