After entering the water, oil (or oil products) typically forms a thin film on the water surface, which is called an oil slick, marine surface slick, or oil sheen. Oil spills can also be present as a thick layer on the water surface in the form of oil-in-water emulsions, which rarely sink to the seabed.
Oil spill detection can spread both horizontally across the water surface and vertically within the water column. Wind and surface water currents are the primary factors responsible for the spread of oil across the water surface. The impact of an oil spill on the environment depends on factors such as the speed and direction of the oil movement, its location relative to human habitats and marine species, and the type and extent of its surface coverage in the ocean.
Monitoring oil spills and oil products(oil spill detection) in water bodies using satellite imaging is a crucial tool for quickly detecting and identifying the sources and locations of oil spills in closed water bodies and marine environments. This information helps in making decisions about effective measures for containment and cleanup.

You can order from us


Oil spill detection solves the following Tasks:
- Detection of incidents of accidental oil spills over a large area.
- Identification of cases of fuel discharge from ships.
- Detection and determination of probable sources of oil slicks.
- Assessment of the drift direction of the oil slick.
- Tracking the appearance, movement trajectory, and disappearance of oil spots.
- Investigation, analysis, and evaluation of the environmental consequences of spills.
- Evaluation of the environmental impact of oil spills.
- Confirmation of the successful completion of reclamation measures.
- Comprehensive assessment of the state of natural and man-made conditions of coastal territories.
- Information support for activities aimed at preventing and eliminating emergency oil and oil product spills.
Advantages of Using Remote Sensing Data (RS Data):
- Minimize field and marine work.
- Rapidly localize and assess the scale of anthropogenic impact, including oil spills.
- Evaluate the degree of influence of anthropogenic impact, including oil spills, on ecosystems.
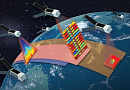
- Significantly reduce the overall duration of work due to the coverage and speed of obtaining data. Currently, for example, Synthetic Aperture Radar (SAR) technology is recognized worldwide as the most effective for detecting and mapping oil spills, thanks to its high spatial resolution and all-weather capabilities of current SAR sensors. In any case, due to their current satellite revisit cycles and the presence of a significant number of SAR-equipped satellites in orbit, RS data technologies can be advantageously used for rapid detection and continuous monitoring in near real-time mode.
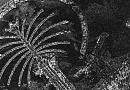
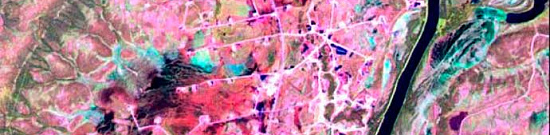
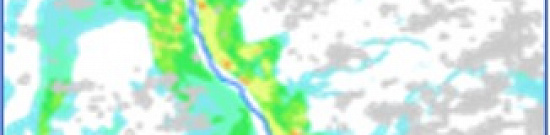
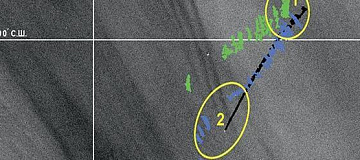
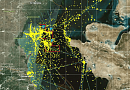
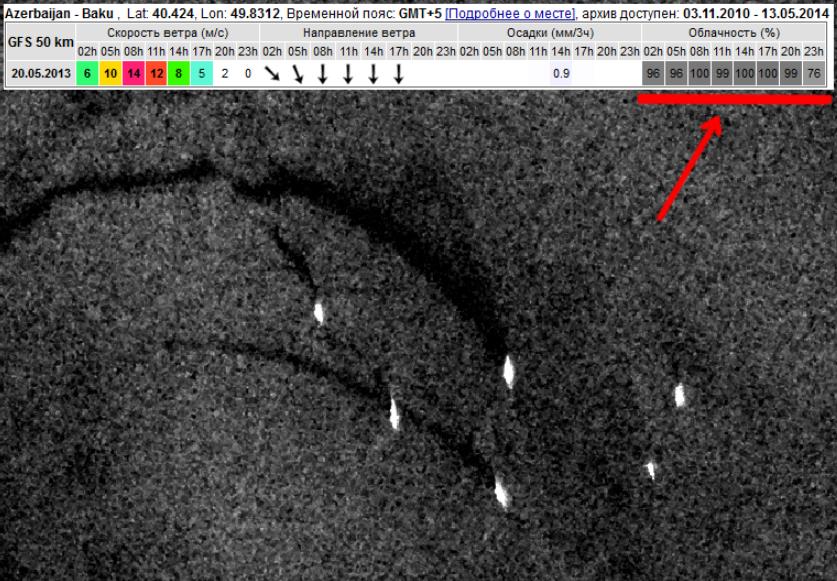 Oil spill in the sea from a platform in the Apsheron Peninsula area. Meteorological data on cloudiness at the time of the image is marked by an arrow. Independence from the time of day (illumination conditions). Radar imaging uses an autonomous source of radiation, allowing obtaining satellite images in the dark. This property, combined with all-weather capabilities, allows for a substantial increase in the amount of extractable information and ensures regular monitoring of the area of interest. Possibility of extracting additional information from satellite images. Besides information about oil contamination, radar images can provide data about the maritime situation at the time of the spill, ice conditions, as well as the extraction of surface wind speed and direction fields at the time of imaging (see figure below), which directly affects the dynamics of the spread of contamination.
 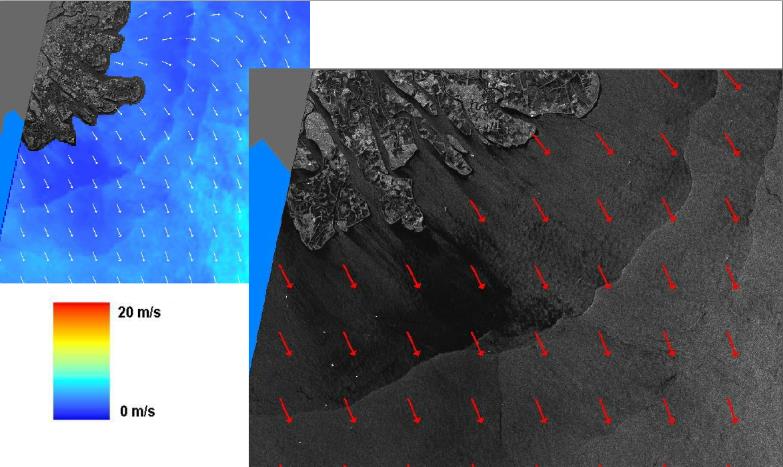 Extraction of the near-surface wind field. Both the direction and speed of the wind are extracted for each of the local areas.
 Satellite radar monitoring technologies for oil pollution are widely used in many countries as part of emergency response systems. There are several approaches to monitoring water bodies using radar data, but they can be divided into 2 main groups: APPROACH № 1: OPERATIONAL MONITORING
National operational control systems for oil pollution in coastal waters and territorial waters can serve as an example of the first group, established in Norway, the USA, Canada, and others.
In Norway, the state system for operational control of accidental pollution of territorial waters is organized based on coordinated satellite and aviation monitoring. In an automated mode, the reception, processing, and analysis of radar information are carried out, along with the comparison of detected pollutions with automated identification system (AIS) data of vessels. The identified pollutions are interpreted with a degree of detection reliability (high, medium, low), and the results are transmitted in real-time through web services to the Norwegian Pollution Control Authority (SFT), operating under the Ministry of Environment. The Norwegian Coast Guard dispatches a patrol aircraft to the accident area, and the observations from the aircraft help refine the scale of pollution and determine the responsible party.
In Canada and the USA, a similar system operates as part of the Integrated Satellite Tracking of Oil Pollution (ISTOP) governmental program.
The disadvantages of this approach include relatively high system costs, the possibility of receiving false alarms/missing real spills (due to automated processing focused on immediacy). Additionally, within the framework of operational monitoring, there is usually no provision for modeling the dynamics of pollution spread.
APPROACH № 1: CREATING COMPLEX GIS-MONITORING SYSTEMS
To address this task, as well as collecting spill statistics for forecasting purposes, the methodologies of the second group are aimed at creating comprehensive GIS-monitoring systems.
Within such systems, which are also widespread in European Union countries (CleanSeaNet, PRIMI programs, etc.) and often complement operational monitoring systems, the collection and integration of archival and new radar images with additional sources of information are part of a unified geoinformation system. The goal is to obtain the most comprehensive information about a specific pollution, analyze its source, and forecast/reconstruct the dynamics of its spread.
The general scheme of the methodology usually consists of the following stages:
- Pre-processing of radar images (radiometric correction, orthotransformation, etc.).
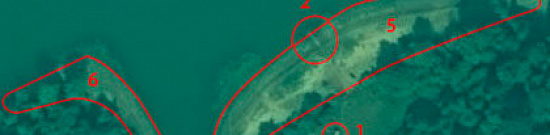
- Detection and extraction of primary information about oil spills (contouring spill areas, assigning attributes, etc.).
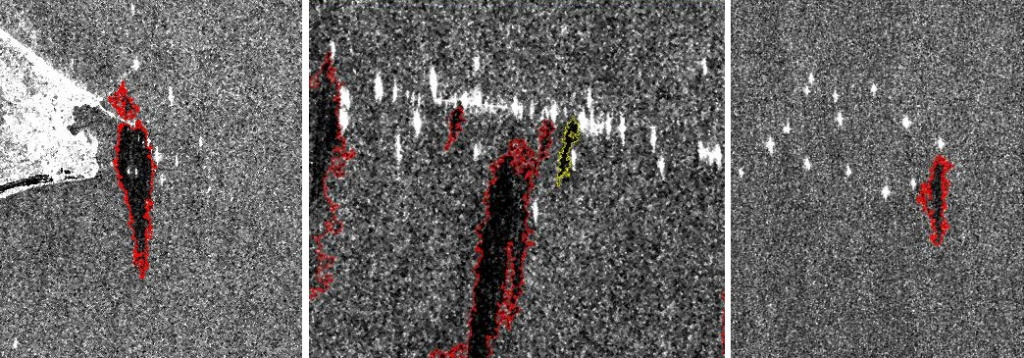
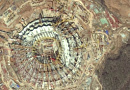
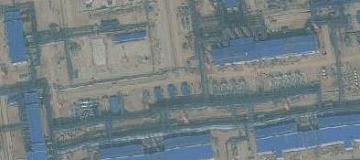
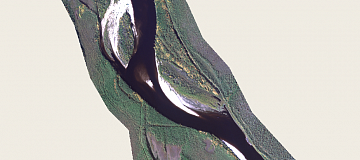
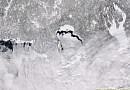
Fig. Oil platform leaks contouring. ERDAS IMAGINE functionality is used.
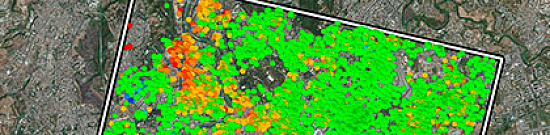
- Extraction of additional information (near-surface wind fields, maritime and ice conditions at the time of space imaging);
- Incorporation of additional data into the project (hydro and meteorological conditions before and after imaging, AIS (Automated Identification System) data, data on the infrastructure of the studied area, physical-geographic description, etc.);
- Comprehensive analysis of all available information within the unified GIS environment. Elimination of "false contaminations" (slick-forming phenomena with similar signatures to oil films on images) and forecasting the dynamics of detected pollutions;
- Optional - transmission of analysis/decoding results to emergency response authorities through a web portal.
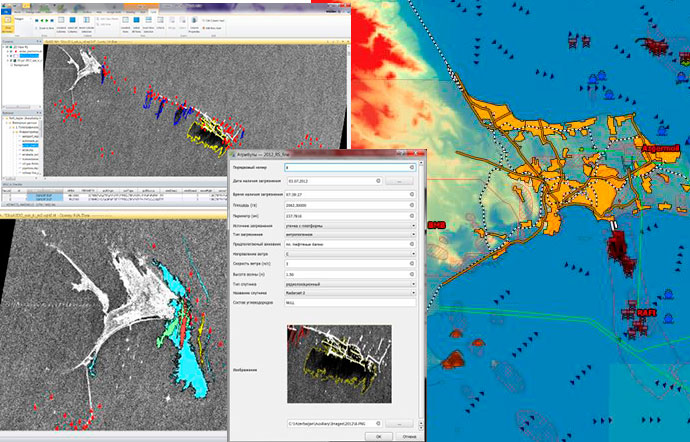
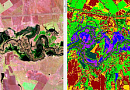
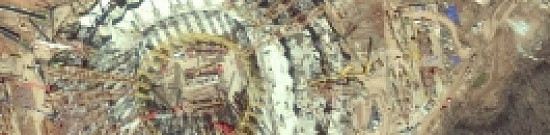
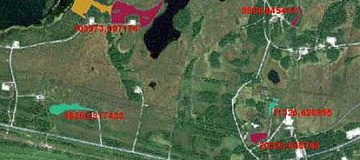
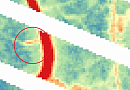
Fig. Example of a comprehensive GIS view by LTD "GEO Innoter" and metadata of several identified oil spills.
The presence of an oil spill monitoring (oil spill detection) system using a complex of aerospace methods with a time lag of about 4 hours (as of December 2022) allows for on-site situation control and environmental analysis for the presence of oil and oil product spills in the area of interest n years prior.In 2014, INNOTER, on behalf of the "Public Association for the Promotion of Science Development - Partner" (Republic of Azerbaijan, Baku), in the interests of the National Aviation Academy of Azerbaijan, performed work on the selection, ordering, pre-processing, and delivery of space images obtained over the Caspian Sea area from radar remote sensing satellites (Contract № 003/C-I-14 dated 23.01.2014).
Training of specialists from the National Aviation Academy of Azerbaijan in the use of the software package "ERDAS Imagine" (including radar functionality) was conducted, including the techniques for monitoring oil spills in the waters of the "Oil Rocks" platform using all-weather, independent of sunlight and cloud cover radar satellite images.
Prices for services
| Consultation | Free of charge |
|---|---|
| Selection of images, preliminary analysis, and technical task preparation | Free of charge |
| Ordering of radar and optical images |
The cost of Earth remote sensing (ERS) materials is calculated individually for each order and may vary: - Application of free satellite images - And/or application of commercial satellite images* |
| Work of technical specialists and experts | From 300,000 RUB |
| TOTAL COST | From 300,000 RUB |
* - if the customer does not provide their materials or it is not possible to use free images.
The cost depends on:
- Area of the area of interest (work area);
- Type of imaging – archival / new, free images / paid images;
- Number of images;
- Quality characteristics of the images;
- Seasonality of work;
- Advance payment amount;
- Whether it is necessary to purchase materials or the customer provides them;
- And more.
The cost of execution is calculated on an individual basis, taking into account a specific of task.
After receiving the task description, we calculate the cost and send you a commercial offer.
Period of execution
The completion time for the work is 20 working days from the date of receiving the advance payment and is calculated individually for each customer.
The completion time for the work depends on:
- Total area of the area of interest;
- Availability of archival Earth remote sensing materials, need for new imaging;
- Requirements for Earth remote sensing materials and the final product.
The timeframe for providing the service depends on the complexity of the work and is calculated individually for each customer.
How to place an order:
Need for consultation?
Fill the form and we will contact you
Stages of service provision
Stage № 0 (Before Contract Conclusion):
- Receiving and coordinating data from the Client. It is necessary to agree on the task requiring a solution, size, terrain characteristics, and product creation requirements to calculate the cost and timing of the work.
RESULT: possibility (YES/NO) of providing the service
Stage № 1 (Before Contract Conclusion):
- Agreement on the technical specification
- Planning of the survey. Suitable archive radar images are selected or a new survey is carried out during the relevant period specified by the Client. The best survey geometry is calculated, and a sequential series of oil spill images is obtained.
- Final determination of labor and material costs, agreement on deadlines and costs.
RESULT: signed contract
Stage № 2 (Contract Execution):
- Performing multispectral space survey of high resolution and SAR within the possible oil spills. Primary processing, especially of radar images, is conducted to eliminate noise and refine the geographical location of objects.
- Photogrammetric processing of space survey materials includes the creation of synthesized images, orthotransformation of survey materials, and the creation of synthesized orthophotomosaics with georeferencing accuracy corresponding to a scale of 1:5,000 and overview scales up to 1:200,000 or higher if needed.
- Comprehensive processing of radar imagery, including expert evaluation, identification of probable oil pollution, and display of their contours in graphical form with temporal and spatial reference.
- Obtaining and processing maps of sea surface temperature, chlorophyll-a concentration, and suspended matter based on MODIS satellite color scanner data;
- Expert forecast of the spread of real and hypothetical oil pollution in the licensed areas (directions, trajectories, and transport speeds) based on specific hydro-meteorological conditions and temperatures;
- Fieldwork stage (by agreement with the Client) includes sample collection, chemical and analytical control, and quantitative chemical analysis. In the case of on-site examination of contaminated aquatic objects, samples of bottom sediments are taken. Lakes with an area of at least 1 hectare are subject to examination, including intra-bog and old riverbeds no longer connected to the river.
- As a result of marine and fieldwork, the following documents are presented: acts of on-site examination of contaminated and contaminated aquatic objects; checklists for summarizing and systematizing the results of on-site examination of the area and laboratory analysis; passports of oil-contaminated marine areas; acts and schemes of sample collection; protocols of quantitative chemical analysis and maps-schemes of contaminated and violated coastal maritime territories.
- At the final stage of deskwork, mapping of natural-anthropogenic objects is performed based on the results of image decoding, marine examination, laboratory research, and the Client's data analysis.
Stage № 3 (GIS Representation)
The following GIS layers of classified data are created:
- Oil-contaminated marine spills on optical images - 1 layer and radar 2nd layer, in the attribute table of which the types and degree of pollution are indicated.
- Tracks - emissions on images from ships and tankers.
- Layers of contaminated or potentially contaminated coastal areas according to meteorological and water conditions (currents, surface and underwater).
- Waste temporary storage sites - 1 layer with an attribute table indicating the types and status: reclaimed (collected cleaned oil film) or unreclaimed.
- Sampling points - 1 layer, in the attribute table of which the type of sample (marine, bottom sediments, coastal soil) is indicated.
Stage № 4 (Presentation of Report Documents)
Oil spill monitoring (oil spill detection) is carried out in accordance with environmental legislation to identify polluted water areas and establish the cause of pollution.
In the conclusion, a final analytical report is prepared, reflecting cartographic, statistical, analytical, and technical information on the work performed, and the overall Register of polluted and disturbed marine waters is presented.
Information on inventorying and documenting polluted and disturbed marine waters is required by oil-producing companies, ship owners, insurers, the judiciary, and organizations of the Ministry of Natural Resources of Russia to develop plans for reclamation work, maintain a stable ecological situation, and prevent violations in the field of nature management.
By the efforts and resources of GEO INNOTER LLC:
Acquiring and processing of space images, creating a digital terrain model, orthotransformation of survey materials, and mapping of natural-anthropogenic objects.
Through local partners:
Fieldwork, chemical-analytical research.
RESULT: Delivery of materials to the Client.

The result of the provision of services
The Client receives an operational and accurate map of oil spills and an assessment of the environmental condition of the spill area and the surrounding environment.
The maps are provided in PDF, GeoTIFF, and isolines (shp) formats.
Requirements for source data:
Precise geographical coordinates of the object in the required coordinate system (specialists of GEO INNOTER LTD will clarify the coordinates provided by the Client in any convenient form).
Software:
- GIS - QGIS, ArcGIS, etc.
- Processing - ERDAS, ENVI SARscape, SNAP, etc.
Related services


Completed projects
Customers


FAQ
- crude oil;
- fuel oil, diesel fuel, etc.;
- removal of petroleum products with river runoff;
- technological discharges from ships;
- drilling waters and sludge;
- oil exits from griffins on the seabed;
- waste from the fishing industry, stained with petroleum products.
- simple geometric shape;
- edges (smooth border with a larger gradient than, for example, natural slicks (leaks) of natural origin);
- size (too large spots are usually slicks of natural origin, for example, clusters of algae or plankton);
- the geographical location of the spots (mainly oil spills occur in areas of oil production or transportation routes of petroleum products).
Licenses
Warranty
We guarantee the execution of works in accordance with building codes and regulations (SNIP), state standards (GOST), and regulatory documents (SP). We adhere to advanced methodologies and utilize the most modern software for our services.
By collaborating with GEO INNOTER specialists, you can be assured of 100% service quality and eliminate risks and losses.
Our team consists of qualified professionals with extensive experience in working with specialized software, ensuring the fulfillment of these guarantees!
Advantages of partnering with GEO INNOTER:
- Years of experience in the field;
- Direct distribution agreements with space imagery operators;
- Experience in handling projects of any complexity, both from aerial imagery and space imagery;
- Access to modern software for processing the latest remote sensing data;
- Robust server capabilities for processing remote sensing data.
The business mission of GEO INNOTER is to provide cutting-edge and efficient services based on remote sensing data.
Our partners


")


")

Sat-Sun: Non-working days