Spill maps in PDF, GeoTIFF and shapefile, pollution GIS layers, a drift forecast and an analytical report on the water area.
Search the site
What the service is used for
Emergency spill
Detection of emergency oil spills over a large area.
Fuel dumping
Detection of fuel dumping from ships.
Slick sources
Detection and identification of likely oil-slick sources.
Slick drift
Assessment of drift direction; tracking the appearance, trajectory and disappearance of slicks.
Reclamation
Confirmation that reclamation measures have been completed successfully and information support for spill clean-up.
Did not find your task?
Send the water-area coordinates, questions and analysis dates — we will assess the archive and the scope of work.
What you will receive as monitoring results
01
Spill map
An operational oil-spill map and an assessment of the environmental state of the spill site and surroundings.
Maps are provided in PDF, GeoTIFF and isolines (shapefile format).
What you get
- an operational oil-spill map
- an assessment of the environmental state of the site and surroundings
- materials in PDF, GeoTIFF and shapefile
Map composition and the coordinate system are fixed in the contract and the terms of reference.
02
GIS layers
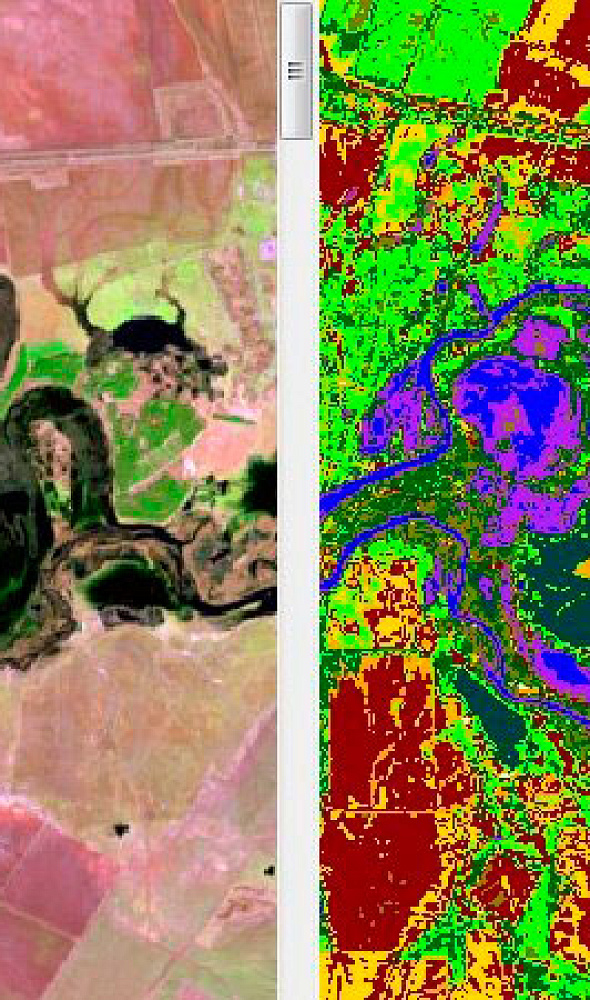
Classified layers: spills on optics and radar, tracks of discharges from ships, coastal areas, waste-storage sites and sampling points.
Attribute tables indicate pollution types and degree, waste types and reclamation status, sample type.
What you get
- layers of contaminated spills on optical and radar images
- a layer of discharge tracks from ships and tankers
- layers of coastal areas, waste and sampling points
The set of layers and attributes is agreed in the terms of reference.
03
Drift forecast
An expert forecast of the spread of real and hypothetical oil pollution: directions, trajectories and transport speeds.
The forecast is built from hydrometeorological conditions and temperatures; ship and ice conditions and the near-surface wind field are extracted from the radar image.
What you get
- a forecast of slick transport direction, trajectory and speed
- pollution contours with temporal and spatial referencing
- additionally: ship and ice conditions, the wind field at the time of acquisition
Forecast accuracy depends on the survey composition and hydrometeorological data for the observation period.
04
Report and register
A final analytical report with cartographic, statistical and technical information and a register of contaminated and disturbed marine areas.
If agreed, field materials are added: inspection reports, passports of oil-contaminated areas, sampling schemes and chemical-analysis protocols.
What you get
- a final analytical report
- a register of contaminated and disturbed marine areas
- if agreed — reports, passports, protocols and field-stage sketch maps
Field work and chemical-analytical studies are performed through local partners.
How the work goes
Cost and timeline
The cost depends on the area of interest, type and number of images, qualitative survey characteristics, work season, advance-payment size and whether the customer provides materials.
- consultation — free of charge
- image selection, preliminary analysis and drafting of the terms of reference — free of charge
- ordering radar and optical images: the cost of RS materials is calculated individually; free satellite images and/or commercial satellite images may be used if the customer does not provide their own materials or free images cannot be applied
- work of technical specialists and expert(s) — from 300 000 RUB
- total cost — from 300 000 RUB; in the cost field — 300 000 RUB
- timeline in the card field — from 20 days; in the timeline block and in the order steps — from 20 working days from the date the advance payment is received
- the timeline depends on the total area of interest, availability of archival RS materials or a new survey, requirements for RS materials and the end product, and work complexity
- in the order steps: study from 300 000 RUB; images are paid separately; payment by bank transfer only
Total cost — from 300 000 ₽
Timeline — from 20 working days
Consultation and preliminary analysis — free of charge
What data are needed for a quote
To assess feasibility, cost and timelines, please provide:
- exact geographic coordinates of the object in the required coordinate system (specialists will refine coordinates provided in any convenient form)
- location of the study object and the questions to be solved
- dates for which the analysis is required
- size, terrain character and product-creation requirements
- your own survey materials or consent to select archival, free or commercial radar and optical images
If the listed information cannot be provided, describe the water area, task and period — specialists will analyse the need and propose an option.
Describe the territory, questions and analysis dates — we will assess the archive and the scope of work.
Why Innoter
Prompt access to archives
Suitable archive imagery can be obtained faster when the required area and date are already available from operators.
No aviation clearances
A new satellite survey does not require the flight clearances typical of aerial surveys.
Large and remote areas
A single satellite pass covers large areas and makes it possible to work in hard-to-reach regions.
Direct agreements with operators
Distribution agreements help select archive imagery and order new surveys from different providers.
Software and server infrastructure
Modern software and computing capacity for quality control and processing of large data volumes.
Experienced specialist team
Years of experience on complex projects and specialists in cartography, photogrammetry and remote sensing.
SAR, optics and monitoring schemes
The composition depends on water-area size, archive or new survey, hydrometeorological conditions and GIS and report requirements.
1
Satellite environmental monitoring of a marine area detects surface pollution by petroleum products, districts and likely sources, transport pathways and environmental damage.
Tasks: an emergency spill over a large area; fuel dumping from ships; likely slick sources; drift direction; tracking the appearance, trajectory and disappearance of slicks; assessment of environmental consequences; confirmation of reclamation; integrated assessment of coastal areas; information support for prevention and clean-up of emergency spills.
Pollution causes are the human factor (tanker collisions, shipwrecks), natural disasters, failures of offshore drilling rigs or underwater oil pipelines.
2
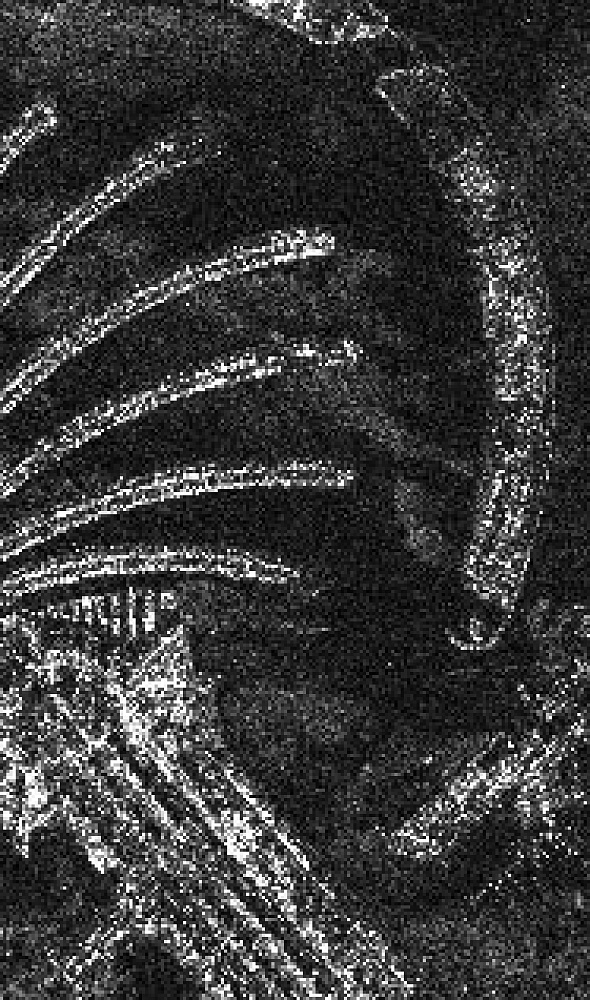
Optical and radar images are used to monitor oil spills; SAR sensors are used more widely because they operate in any weather. Interpretation accuracy depends on biogenic elements that produce false-positive spill signatures.
RS data make it possible to minimise marine field work, promptly localise the scale of impact, assess the effect on ecosystems and shorten timelines thanks to coverage. SAR technology is recognised as the most effective for detecting and mapping spills thanks to high spatial resolution and all-weather sensors.
Automation of RS material processing relies on AI and neural-network algorithms over a large water area. Identification of oil pollution follows methods adopted by the European Space Agency; additionally the IR and visible ranges from MODIS radiometers (Terra and Aqua satellites) and near-surface hydrometeorological information are analysed.
3
An oil-slick drift forecast requires radar satellite images. Microwave emission of spaceborne radar (3.1 cm, X-band — 23.5 cm, L-band) has high penetrating ability: the survey does not depend on cloud, fog or smoke and is also used to detect underground utilities.
Radar imaging uses an autonomous radiation source and yields images at night. Combined with all-weather capability this increases the volume of information and provides regular monitoring of the water area.
Besides oil pollution, a radar image yields ship and ice conditions and fields of near-surface wind speed and direction at the time of acquisition.
4
Satellite radar monitoring technologies for oil pollution are part of operational response systems. The first approach is operational monitoring of coastal waters and territorial waters (Norway, the USA, Canada and others).
In Norway the system combines satellite and airborne monitoring: reception, processing and analysis of radar information, comparison with AIS data, interpretation with a confidence degree (high, medium, low) and transfer to the Norwegian Pollution Control Authority (SFT). The coast service dispatches a patrol aircraft. In Canada and the USA a similar system operates within ISTOP (Integrated Satellite Tracking of Oil Pollution).
Drawbacks of the approach: relatively high system cost, the probability of false alarms or missed real spills in automated processing; as a rule, modelling of pollution-spread dynamics is not provided.
5
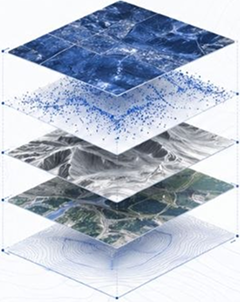
The second approach is integrated GIS monitoring systems: collection of archival and new radar images with additional sources in a single geoinformation system (CleanSeaNet, PRIMI and other programmes in EU countries).
Methodology stages: preliminary image processing (radiometric correction, orthorectification); detection and outlining of spills with attributes (including in ERDAS IMAGINE); extraction of the near-surface wind field, ship and ice conditions; connection of hydro and meteo data, AIS and infrastructure; integrated GIS analysis and rejection of “false pollution” (slick-forming phenomena); optionally — transfer of results to response bodies via a web portal.
A monitoring system with a lag of about 4 hours (as of 2022.12) makes it possible to control the situation on site and analyse the presence of spills n years earlier. In 2014 INNOTER, under contract No. 003/C-I-14 of 23.01.2014, selected, ordered, pre-processed and delivered radar images of the Caspian Sea for the National Academy of Aviation of Azerbaijan and provided training in ERDAS Imagine, including monitoring of the Oil Rocks platform.
6
A quote requires exact geographic coordinates of the object. Software: GIS — QGIS, ArcGIS and others; processing — ERDAS, ENVI SARscape, SNAP and others.
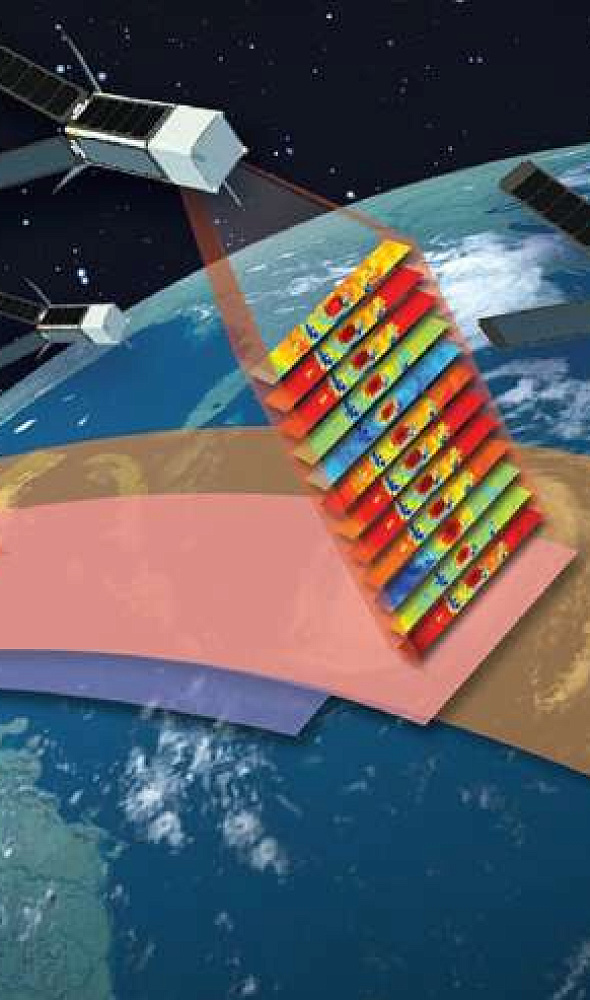
At the execution stage a very-high-resolution multispectral satellite survey and SAR are performed; primary processing of the radar image; photogrammetric processing — fused images, orthorectification and orthomosaics with georeferencing accuracy corresponding to scale 1:5 000 and overview products down to 1:200 000 or more if required. Additionally, sea-surface temperature, chlorophyll-a and suspended-matter maps from the MODIS colour scanner are processed.
The field stage, if agreed: sampling, chemical-analytical control; lakes of at least 1 ha are surveyed, including intra-bog lakes and oxbows. Acquisition and processing of satellite images, DEM, orthorectification and mapping — by GEO INNOTER LLC; field work and chemical-analytical studies — through local partners.

Frequently asked questions
Answers to key questions about service parameters, timelines, deliverable formats and workflow. If you did not find what you need — contact us and we will help.
- crude oil;
- fuel oil, diesel fuel, etc.;
- removal of petroleum products with river runoff;
- technological discharges from ships;
- drilling waters and sludge;
- oil exits from griffins on the seabed;
- waste from the fishing industry, stained with petroleum products.
First of all, the spots are different in satellite images:
- simple geometric shape;
- edges (smooth border with a larger gradient than, for example, natural slicks (leaks) of natural origin);
- size (too large spots are usually slicks of natural origin, for example, clusters of algae or plankton);
- the geographical location of the spots (mainly oil spills occur in areas of oil production or transportation routes of petroleum products).
The developed scheme consists of first detecting dark spots in the image, then calculating a set of features for each dark spot, after which the spot is classified as an oil spot or its "twin" (other oceanographic phenomena), which are similar to oil spots. The classification rule is constructed by combining statistical modeling with a rules-based approach.
Prior knowledge of the higher probability of the presence of oil spills around ships and oil platforms is included in the model. In addition, knowledge about external conditions such as wind level and the environment of the spot is taken into account.
Statistical image segmentation is typically used to distinguish similar images from oil spills with varying degrees of accuracy. With the advent of digitalization technologies - machine learning (ML) and deep learning (DL) models, models that are more promising than statistical methods are methods for creating support vectors (SVM) and artificial neural network (INS). They are the main machine learning algorithms for oil spill detection. Also, mathematical models based on the Lagrange method have improved the prediction of the oil spill trajectory with higher accuracy in real time than traditional approaches based on the worst case, average and survey.
However, these new models are still not able to quantify oil droplets and uncertainty in predicting vulnerability. It is believed that further in-depth development of the geospatial computer vision system and technology will solve these problems.
The development of radar survey methods and the accumulation of their fund is essential for oil and gas production areas, which in Russia fall on territories with difficult weather conditions and where all-weather radar survey can be a more reliable monitoring method. It is also important that various types of vegetation, humidity of surface soils, dams, roads, pipelines, industrial sites are displayed on radar images. Another unique property of radar images is the display on them of oil pollution of the sea surface, oil slicks, which stand out in the images due to the fact that the oil film restrains the excitement and causes a change in the roughness of the water surface.
The methods of remote sensing of the Earth's surface from artificial Earth satellites can also be used very effectively in solving the problems of identifying and controlling the migration routes of surface water pollution zones by oil.
In particular, with their help, it is possible to quickly track the migration routes of large oil spills from oil that has entered the water in the event of accidents of tankers, underwater or coastal oil pipelines; to identify forest fires in forest zones that occur near the areas of oil pipelines and oil storage facilities; to determine by remote photogrammetry threatening pipeline ruptures invisible directly on the Earth's surface slow deformations of extended oil pipelines and etc .
Radar images and, if necessary, optical images are used to monitor oil pollution and oil product spills and control their spread. Identification of oil pollution is carried out according to the methods adopted by the European Space Agency.
Satellite monitoring of oil pollution is carried out taking into account the analysis of satellite images of the sea surface in the infrared and visible ranges of the spectrum according to MODIS radiometers (Terra and Aqua satellites) and surface hydrometeorological information (wind speed and direction, currents, height of wind waves, etc.).
Need satellite imagery or help choosing the right data?
Describe your task, area of interest, and desired outcome. We will check data
availability, assess new acquisition options, and propose the optimal solution in terms of timelines, cost,
and quality.
Discuss the project
clients who trust us
25+ years in the geodata market