Contact

What the service is used for

Precision agriculture
Implementation of precision agriculture or No-Till technologies; machinery routes with GLONASS.
Soil fertility passport
Creation of a soil fertility passport and cartograms of soil properties.
Environmental monitoring
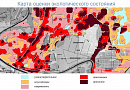
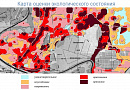
Environmental monitoring of agricultural lands.
Yield
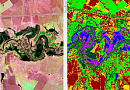
Yield analysis and creation of thematic field maps.
Cadastre and planning
Land management and cadastral work, territorial planning, road construction.
Did not find your task?
Send the farmland outline, the task and whether attributes are needed — we will calculate the scope and cost.

What you will receive as a result of the work

A vector layer of farmland boundaries in SHP, KML or GeoJSON, field attributes and index maps from multispectral imagery.

01

Vector boundary layer

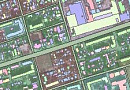
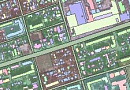
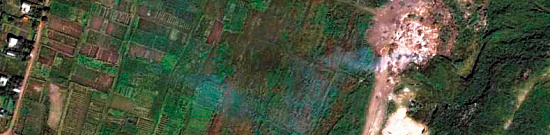
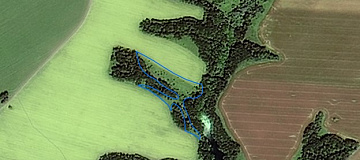
Vectorized boundaries of lands used in agriculture: arable land, pastures, hayfields, orchards.
A high-precision base from aerospace imagery aggregates diverse information about fields in a single spatially referenced file.
What you get
  • a vector file with farmland boundaries for the area of interest
  • ArcGIS SHP, Google KML, GeoJSON formats
  • export to agreed coordinate systems and projections
The delivery composition and coordinate system are fixed in the contract and the terms of reference.
02

Field attributes

Depending on the objectives and input parameters — field area, crop type, phosphorus and potassium content, and other agrochemical indicators.
Attribute information can be delivered separately as an Excel file or as shapefile attributes. By default, only the area is added to the table.
What you get
  • attributes in Excel and/or in the shapefile semantics
  • filling methods are agreed in advance: averaging the index over the field, the median value and others
  • an explanatory note to the vector file
The list of attributes depends on the data the client is ready to provide.
03

Index maps

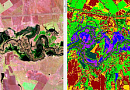
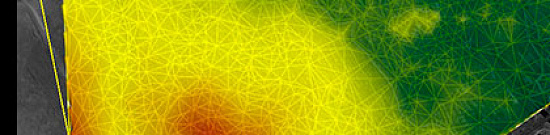
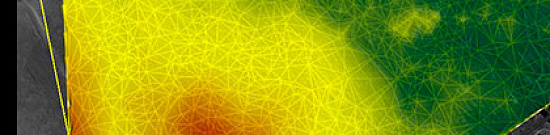
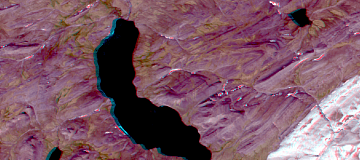
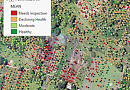
Processing of multispectral imagery produces biomass index maps for analyzing agricultural land.
NDVI, NDWI, GNDVI, ENVI, PVI, WDVI, DVI, LAI and other indices are used for vegetation, soil moisture and yield forecasting.
What you get
  • assessment of vegetation intensity (NDVI)
  • soil moisture (NDWI), germination, biomass increment and chlorophyll content
  • yield forecast, crop density, infected areas
The set of indices and the depth of analysis depend on the agreed imagery and the terms of reference.

How the work goes

1
Request
Location of the object (coordinates, district, region, shp file) and a comment on whether an expanded attribute table is required. By default, only the area is added to the table.
2
Archive and method assessment
Check of commercial and free Earth remote sensing archives and retrospective data; default method — unsupervised classification using standard pseudo-colors; coordinate system of the result.
3
Technical task and cost
The price of the vector layer is negotiated in each case. Imagery is paid separately: from 0.01 to 200 USD per 1 km² depending on the survey.
4
Contract and advance payment
From 5 business days from the date of receiving 100% advance payment for remote sensing materials; payment by bank transfer only, the remainder after completion. We work with individuals and legal entities, individual entrepreneurs, public authorities and foreign clients.
5
Classification and vector
After the advance payment: ordering imagery, incoming inspection, pseudo-colors, classification, vector layer; if required — attributes and export to a coordinate system.
Ready to start?
Send the area outline, the task and the attribute set — we will prepare an assessment of feasibility and cost.

Cost and timeline

The price depends on the type of survey, the area, the complexity of the territory and whether only field boundaries are needed or an attribute table as well.
  • consultation — free of charge
  • imagery order — from 0.01 to 200 USD per 1 km² depending on the survey (free or commercial, archive or new, mono or stereo, resolution)
  • image processing (pansharpening, unsupervised classification, vectorization) — from 0.01 USD per 1 km²
  • analysis of additional attribute information — from 0.01 USD per 1 km²
  • creation of a vector layer — the price is negotiated in each specific case
  • imagery is paid separately
  • total estimate — from 50 000 ₽; in the table the wording is “From 50,000 RUB days*”
  • turnaround time — from 6 days; total in the timeline block — from 6 business days; execution — from 5 days from the date of receiving 100% advance payment
  • in the FAQ the minimum term is from 5 (five) business days, calculated individually (cost of Earth remote sensing data, size and complexity of the territory)
  • approval of the terms of reference — from 1 to 5 business days; contract signing — from 1 to 5 business days
  • payment: order steps — from 5 business days from the date of receiving 100% advance payment for remote sensing materials, bank transfer, remaining payment after completion; in the FAQ — 100% prepayment by invoice after signing the contract

Order cost — from 50 000 ₽

Timeline — from 6 days (execution — from 5 days with 100% advance payment)

Consultation — free of charge

What data is needed for a quote

To assess feasibility, cost and timeline, please provide:
  • the area of interest: location or coordinates of the object in any convenient form, and the area
  • the specific task to be solved using digital land maps
  • whether an expanded attribute table is required (by default, only the area is added to the table)
  • if attributes are needed — which data can be provided: field description points, field yields, agrochemical center data
  • accurate geographic coordinates of the object in the required coordinate system
  • attribute information in Excel or shapefiles, if available

If the listed information cannot be provided, describe the intended use of the remote sensing data — specialists will analyze the requirements and propose an optimal option.

Describe the farmland outline, the task and whether attributes other than area are needed.

Why Innoter

Prompt access to archives
Suitable archive imagery can be obtained faster when the required area and date are already available from operators.
No aviation clearances
A new satellite survey does not require the flight clearances typical of aerial surveys.
Large and remote areas
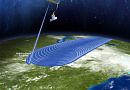
A single satellite pass covers large areas and makes it possible to work in hard-to-reach regions.
Direct agreements with operators
Distribution agreements help select archive imagery and order new surveys from different providers.
Software and server infrastructure
Modern software and computing capacity for quality control and processing of large data volumes.
Experienced specialist team
Years of experience on complex projects and specialists in cartography, photogrammetry and remote sensing.

Earth remote sensing data, order stages and indices

The composition depends on archive or new imagery, attributes and requirements for the vector layer.
1

Digital maps of agricultural land are a vectorized representation of the boundaries of lands used in agriculture: arable land, pastures, hayfields, orchards, etc.

The purpose is to aggregate diverse information about fields in one file with spatial referencing and boundaries. The high-precision base from aerospace imagery makes it possible to plan agricultural machinery routes correctly and to work in software that uses GLONASS technologies.

The availability of digital maps simplifies the implementation of precision agriculture, environmental certification and the identification of discrepancies between arable land and the cadastre.

2

Remote sensing data is the only source of continuous and multi-temporal information available for almost all regions of the world.

Multispectral information makes it possible to analyze the territory in channel combinations that correlate with the properties of agro-landscapes. Analysis using the NDVI index in certain cases allows for assessing the nitrogen content available to plants. The high spatial resolution of the images ensures accuracy in modeling and digitizing land boundaries.

3

If only field boundaries are needed: commercial and free Earth remote sensing archives are checked; whether retrospective data are required is clarified, including for areas where agricultural work was previously conducted; the method is agreed (by default, unsupervised classification using standard pseudo-colors) and the requirements for the final data, including the coordinate system.

If an attribute table is needed, the list of attributes based on the client’s data, Earth remote sensing imagery for this purpose and the methods of assigning attributes (averaging the index for the field, the median value, etc.) are additionally agreed.

The result of the stage is agreed labour and materials, timeline, cost and a signed contract.

4

General procedure: receiving 100% advance payment, ordering satellite imagery materials, incoming inspection of remote sensing data, synthesis of standard pseudo-colors, classification, creation of a vector layer, export to coordinate systems and projections.

For the option with attributes, synthesis of auxiliary layers and filling of the attribute table are added.

Result of execution: a vector file (shp, kml, GeoJSON) with field boundaries and an explanatory note.

5

Processing of multispectral imagery produces biomass index maps: NDVI, NDWI, GNDVI, ENVI, PVI, WDVI, DVI, LAI and others.

They are used to assess vegetation intensity, forecast yields (including for selling the future harvest to traders or reducing insurance costs), check crop density and germination, conduct environmental monitoring, calculate soil moisture (NDWI) and the content of micro- and macroelements, determine biomass increment, identify infected areas, the type of damage and pests, and assess chlorophyll content, the degree of aging and plant stress.

6

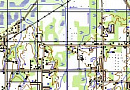
High-resolution satellite images make it possible to compile maps of agricultural land, cadastral maps and land-use photoplans at scales down to 1:50 000 and 1:25 000.

Cartographic sources of land management are plans and schemes at scales from 1:5 000 to 1:200 000; topographic maps — up to a scale of 1:300 000. Maps of land plots are the base for the remaining agricultural maps.

Case study

Related services

We expand project capabilities with additional data and imaging types. We will select the right source — from satellite and aerial imagery to LiDAR and radar materials — for your territory, timeline, and task.

Frequently asked questions

Answers to key questions about service parameters, timelines, deliverable formats and workflow. If you did not find what you need — contact us and we will help.
  • area of interest (location / coordinates of the object in any convenient form, and area of the object);
  • the specific problem to be solved using digital land maps.
depend on the cost of RS data, size and complexity of the territory and is calculated individually for each customer. Minimum - from 5 (five) working days.
100% prepayment by invoice after signing the contract.
are based on the general methodological principles of complex thematic mapping. Thematic completeness, detail (mapping unit - farm), transfer of interrelationships, integral characterization make it possible to show agriculture on maps as a single territorial system. Each map is considered as a part of a single complex, as a reflection of a side or property of agricultural production.
Characterize the economic past of the territory. To create them, it is necessary to analyze and summarize as much information as possible about the mapped period on the topic of the map. They can be schematic and made without using quantitative indicators only in the complete absence of source data and the need to display a specific topic. This type of map requires the use of special research techniques and knowledge not only of geography and cartography, but also of history.
Compliance of the actual use with the intended purpose and authorized use of land plots, as well as changes in the condition of lands of all categories due to the impact of natural and anthropogenic processes shall be established based on the results of monitoring of land use. Maps of land use shall reflect the relationship of land plots with natural conditions, which is necessary for scientific forecasting of rational use of lands.

Cartographic: land management materials (land management plans and schemes at scales from 1:5 000 to 1:200 000), forest management, topographic maps (up to a scale of 1:300 000), maps of land plots, which serve as the base for compiling all other agricultural maps.

Statistical: for large regions and countries as a whole — summary materials by districts, regions, federal subjects; then annual reports of individual agricultural enterprises and agronomists; land report data, agricultural census survey data.

Remote sensing materials: high-resolution satellite images used for creating maps of agricultural land, cadastral maps, and land use photoplans at scales up to 1:50 000 and 1:25 000.

Field research: used mainly for regional agricultural mapping — route and key surveys of farms following a specially developed program.

They appeared in the middle of the XIX century in the "Economic and Statistical Atlas of European Russia" (1851) and characterized the location of the main branches and crops of agriculture. At the end of XIX - beginning of XX centuries a number of interesting agricultural maps and atlases were published: "Map of the most important branches of productivity of European Russia" (1872), which shows the areas of bread growing, flax growing, beet growing, tobacco growing, silk growing; the famous "Atlas of Asian Russia" (1914), complex in its content, but oriented to display the conditions of agricultural development of the Asian part of Russia in the early 20th century; the album "Agricultural Trades in Russia" (1914), which is a collection of statistical maps that characterize the country's agriculture by large territorial units - provinces. Of the numerous agricultural maps, the "Map of Agriculture of the USSR" (1926), compiled under the direction of N. I. Vavilov using the point method, is of particular interest. This method was further developed and improved when drawing agricultural maps by BSAM. The "Atlas of Agriculture of the USSR" (1960) and the "Atlas of the Development of National Economy and Culture" (1967) belong to the overview agricultural mapping.

Lands of agricultural purpose are recognized as lands located outside of populated areas, provided for agricultural needs, and intended for such purposes.

Within agricultural land, the following are distinguished: agricultural lands, lands occupied by intra-farm roads, communications, protective afforestation for land improvement, water bodies (including ponds formed by water retention structures on watercourses and used for pond aquaculture), capital construction objects, non-capital buildings and structures used for the production, storage and primary processing of agricultural products, in cases provided by federal laws, non-stationary retail facilities, and also residential houses whose construction, reconstruction and operation are allowed on land plots used by peasant (farm) households for their activities, or on land plots intended for citizens' gardening for personal use (Article 77 of the Land Code of the Russian Federation).

clients who trust us
25+ years in the geodata market
Request a call back
Back to page top
Мы используем Яндекс.Метрика и собственные Сookies для обеспечения наилучшего опыта работы на нашем сайте, персонализации сайта для наших пользователей и аналитики. Продолжая использовать сайт вы соглашаетесь с условиями Пользовательского соглашения.