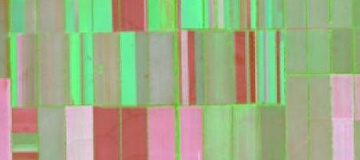
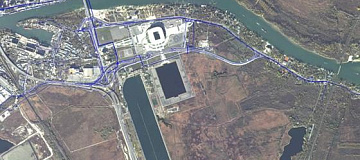
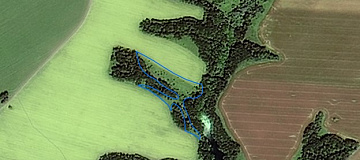
Digital agriculture mapping (Crop monitoring) - a vector representation of the boundaries of lands used in agriculture: arable land, pastures, hayfields, orchards, etc. Depending on the objectives and available input parameters, the final data may include the following attribute information: field area, crop type, phosphorus and potassium content, and other agrochemical indicators.

The availability of digital agricultural land maps allows for the implementation of precision farming technologies and simplifies the procedure of environmental certification. It also helps to identify discrepancies between arable land and the cadastral register.

Digitalization of Agriculture - a promising direction that aligns with the goals of sustainable development and the increasing demand for product quality.

Работник

Purposes and Objectives of Digital agriculture mapping (Crop monitoring):

The purpose of creating digital agricultural land maps is to aggregate diverse information about fields in one file, which includes spatial referencing and information about field boundaries. The high-precision foundation obtained from the analysis of aerospace imagery allows for proper route planning of agricultural machinery and working with programs using GLONASS technologies.

The objectives that can be achieved using electronic agricultural land maps (crop monitoring) include:

  • Implementation of precision farming or No-Till technologies;
  • Creation of soil fertility passports;
  • Environmental monitoring;
  • Creation of cartograms of soil properties;
  • Yield analysis and creation of thematic maps;
  • Execution of land management and cadastral work;
  • Territorial planning;
  • Construction of roads, highways, and intersections;


Advantages of Using Remote Sensing Data:

Remote sensing data is the only source of continuous and multi-temporal information available for almost all regions of the world. The presence of multispectral information allows for the analysis of the territory in various channel combinations, which can correlate well with the essential properties of agro-landscapes. For example, analyzing the territory using the NDVI index in certain cases allows for assessing the nitrogen content available to plants. The high spatial resolution of the images ensures accuracy in modeling and digitizing land boundaries.

Prices for services

Consultation Free
Image Order From 0.01 to 200 USD per 1 km2 depending on the type of image (free-commercial, archive-new, mono-stereo, resolution)
Image Processing (pan-sharpening, unsupervised classification, vectorization) From 0.01 USD per 1 km2
Additional Attribute Information Analysis From 0.01 USD per 1 km2
TOTAL From 50,000 RUB per day*

The cost of execution is calculated on an individual basis, taking into account a specific of task.

After receiving the task description, we calculate the cost and send you a commercial offer.

Period of execution

Technical task approval: from 1 to 5 days*
Contract signing: from 1 to 5 days*
Work execution: from 5 days**
TOTAL TIME: from 6 days*

* business days
** from the date of receiving 100% advance payment

How to place an order:

  1. STEP #1: Submit an application on the website with the following information:
    • Location of the object of interest (coordinates, district name, region, SHP file, etc.);
    • Comment on whether an expanded attribute table is required (by default, only the area will be added to the table). If needed, specify which data can be provided for its compilation (field description points, field yield, data from agrochemical center, etc.).
  2. STEP #2: Technical task and cost approval:
    • Creating a vector layer - the price is negotiated in each specific case;
    • Images are paid separately (from 0.01 to 200 USD per 1 km2 depending on the type of imaging: free-commercial, archive-new, mono-stereo, resolution).
  3. STEP #3: Signing the contract and starting the work

    From 5 business days from the date of receiving 100% advance payment for satellite imagery - payment is only via non-cash settlement. The rest of the payment is made after the completion of the work.

We work with individuals, legal entities, individual entrepreneurs, government and municipal authorities, foreign customers, etc.).

Need for consultation?

Fill the form and we will contact you

By clicking the «Send» button, you give your consent to the processing of your personal data, in accordance with Federal Law No. 152-FZ of July 27, 2006 «On Personal Data», on the conditions and for the purposes specified in the Consent to the processing of personal data.

Stages of service provision

Stage #1 (BEFORE contract conclusion):

  1. If the customer wants only field boundaries:
    1. Check the archives of remote sensing data (both commercial and free);
    2. Clarify the need for using retrospective data (including identifying areas where agricultural work was previously conducted);
    3. Agree on the method (by default, unsupervised classification using standard pseudo-colors);
    4. Agree on the requirements for the final data (including the coordinate system).
  2. If the customer wants to fill in the attribute table, then in addition to the points described above:
    1. Agree on the list of attributes, considering the information that the customer is willing to provide;
    2. Agree on the remote sensing data that will be used for this purpose;
    3. Agree on the methods by which attributes will be assigned (e.g., averaging index values for the field or selecting median values, etc.);
  3. Final determination of labor and material costs, agreement on delivery dates and cost.

RESULT: Signed contract


Stage #2 (Contract Execution):

Order of contract execution


For option-1:

  • Receive 100% advance payment
  • Order satellite imagery materials
  • Incoming control of remote sensing data
  • Synthesis of standard pseudo-colors
  • Perform classification
  • Create a vector layer
  • Data export to various coordinate systems and projections


For option-2:

  • Receive 100% advance payment
  • Order satellite imagery materials
  • Incoming control of remote sensing data
  • Synthesis of standard pseudo-colors
  • Perform classification
  • Create a vector layer
  • Synthesis of auxiliary layers for determining previously agreed attributes
  • Fill in the attribute table
  • Data export to various coordinate systems and projections


RESULT: Vector file (shp, kml, GeoJSON) containing field boundaries; explanatory note

The result of the provision of services

The customer receives a vector file with land parcel boundaries for their area of interest. Vector formats include ArcGIS SHP, Google KML, and GeoJSON.

Attribute information can be provided separately as an Excel file or as attribute information within the shapefile.

Processing of multispectral images allows the generation of maps for various biomass indices (NDVI, NDWI, GNDVI, ENVI, PVI, WDVI, DVI, LAI, etc.), which are used for analyzing agricultural lands with the following capabilities:

  • Assess the vegetation intensity of agricultural crops (Normalized Difference Vegetation Index, NDVI);
  • Forecast crop yields for agricultural crops, including for future crop sales to traders or to reduce costs for future crop insurance;
  • Check crop density;
  • Evaluate crop germination rates;
  • Conduct ecological monitoring of agricultural lands;
  • Calculate soil moisture (NDWI) and determine the content of micro and macroelements in the soil;
  • Determine biomass growth;
  • Detect infected areas, types of infection, and pests;
  • Assess chlorophyll content, degree of aging, and plant stress levels.


Initial Requirements

Accurate geographic coordinates of the object in the required coordinate system.

Attribute information in Excel or shapefile format.

If it is not possible to provide the specified information, please provide details of the intended use of the remote sensing data, and the specialists of GEO Innoter will analyze the requirements and propose an optimal solution to the problem.

Related services

Forensic Imagery Analysis (Expert Opinion)
Find out the price
Satellite imagery. Satellite data
Find out the price
Digital orthoimagery (Orthorectification)
Find out the price
Forest inventory
Forest inventory
Find out the price
Photogrammetric processing (Image Processing)
Find out the price
Modeling the Territorial Structure Dynamics
Find out the price
Фотограмметрические работы
Find out the price
Заказ космической съемки. Космоснимки
Find out the price
Заключение эксперта
Заключение эксперта
Find out the price
Создание ортофотопланов
Find out the price
Таксация лесов (Оценка лесных участков)
Find out the price
Изучение структуры и динамики природных территориальных комплексов
Find out the price
Zazulyak Evgeny Leonidovich
The material was checked by an expert
Zazulyak Evgeny Leonidovich
Engineer, 28 years of experience, Education - Moscow Topographic Polytechnic Technical School, St. Petersburg Higher Military Topographic Command School named after Army General A.I. Antonov, Military Engineering University named after V.V. Kuibyshev. Kuibyshev Military Engineering University.

Customers

FAQ

  • area of interest (location / coordinates of the object in any convenient form, and area of the object);
  • the specific problem to be solved using digital land maps.
depend on the cost of RS data, size and complexity of the territory and is calculated individually for each customer. Minimum - from 5 (five) working days.
100% prepayment by invoice after signing the contract.
are based on the general methodological principles of complex thematic mapping. Thematic completeness, detail (mapping unit - farm), transfer of interrelationships, integral characterization make it possible to show agriculture on maps as a single territorial system. Each map is considered as a part of a single complex, as a reflection of a side or property of agricultural production.
Characterize the economic past of the territory. To create them, it is necessary to analyze and summarize as much information as possible about the mapped period on the topic of the map. They can be schematic and made without using quantitative indicators only in the complete absence of source data and the need to display a specific topic. This type of map requires the use of special research techniques and knowledge not only of geography and cartography, but also of history.
Compliance of the actual use with the intended purpose and authorized use of land plots, as well as changes in the condition of lands of all categories due to the impact of natural and anthropogenic processes shall be established based on the results of monitoring of land use. Maps of land use shall reflect the relationship of land plots with natural conditions, which is necessary for scientific forecasting of rational use of lands.

Cartographic materials:
- Land management plans and schemes in scales ranging from 1:5,000 to 1:200,000.
- Forestry management plans.
- Topographic maps up to a scale of 1:300,000.
- Land use maps, which serve as the base for all other agricultural maps.

Statistical materials:
- Aggregate data for large regions and countries, including summaries for districts, regions, and federal subjects.
- Annual reports from individual agricultural enterprises and agronomists.
- Land reports and agricultural census data.

Remote sensing materials:
- High-resolution satellite images used for creating maps of agricultural land, cadastral maps, and land use photoplans at scales up to 1:50,000 and 1:25,000.

Field research:
- Primarily used for regional agricultural mapping, involving route and key surveys of farms following a specially developed program.

They appeared in the middle of the XIX century in the "Economic and Statistical Atlas of European Russia" (1851) and characterized the location of the main branches and crops of agriculture. At the end of XIX - beginning of XX centuries a number of interesting agricultural maps and atlases were published: "Map of the most important branches of productivity of European Russia" (1872), which shows the areas of bread growing, flax growing, beet growing, tobacco growing, silk growing; the famous "Atlas of Asian Russia" (1914). The famous "Atlas of Asian Russia" (1914), complex in its content, but oriented to display the conditions of agricultural development of the Asian part of Russia in the early 20th century; the album "Agricultural Trades in Russia" (1914), which is a collection of statistical maps that characterize the country's agriculture by large territorial units - provinces. Of the numerous agricultural maps, the "Map of Agriculture of the USSR" (1926), compiled under the direction of N. I. Vavilov using the point method, is of particular interest. This method was further developed and improved when drawing agricultural maps by BSAM. The "Atlas of Agriculture of the USSR" (1960) and the "Atlas of the Development of National Economy and Culture" (1967) belong to the overview agricultural mapping.

Lands of agricultural purpose are recognized as lands located outside of populated areas, provided for agricultural needs, and intended for such purposes.

Within the lands of agricultural purpose, the following are distinguished:

  • Agricultural lands;
  • Lands occupied by intra-farm roads, communications, protective afforestation for land improvement, water bodies (including ponds formed by water retention structures on watercourses and used for pond aquaculture purposes);
  • Objects of capital construction and non-capital structures used for the production, storage, and primary processing of agricultural products, as provided by federal laws;
  • Non-stationary retail facilities;
  • Residential houses, construction, reconstruction, and operation of which are allowed on land plots used by peasant (farm) households for their activities, or on land plots intended for citizens' gardening for personal use (Article 77 of the Land Code of the Russian Federation).
Digital agriculture mapping utilizes remote sensing data to monitor crops by providing information on vegetation health, growth patterns, and crop conditions. Specific data obtained includes Normalized Difference Vegetation Index (NDVI), chlorophyll content, and land surface temperature, enabling precision farming practices.
UAVs in digital agriculture mapping offer high-resolution and timely data collection capabilities. They provide detailed imagery, multispectral data, and 3D terrain models, allowing for more accurate and frequent crop monitoring compared to traditional methods. UAVs enhance precision agriculture practices by enabling targeted interventions based on real-time information.
Remote sensing data aids in detecting crop diseases, pests, and nutrient deficiencies by capturing spectral signatures associated with stressed vegetation. This information allows for early intervention by farmers, enabling targeted treatments, optimizing resource use, and minimizing crop losses.
Digital agriculture mapping supports yield estimation and forecasting by analyzing crop health, density, and growth patterns. Farmers can use this information to make informed decisions about irrigation, fertilization, and harvesting schedules, optimizing yield and resource efficiency.
Machine learning and data analytics enhance digital agriculture mapping by enabling the automated analysis of large datasets. These technologies can identify complex patterns in remote sensing data, allowing for the development of predictive models for crop monitoring. This integration enhances the accuracy of monitoring, enabling farmers to make data-driven decisions for crop management.

Licenses

Our partners