Nighttime satellite images, thematic materials, maps and an analytical report; radar — by agreement.
Search the site
What the service is used for
Cartography
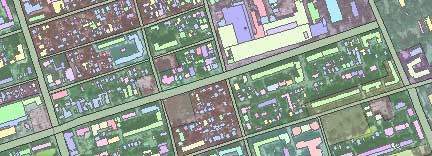
Creation of topographic maps and plans from nighttime imagery.
Socio-economic maps
Thematic maps of economic growth, poverty and inequality; a household wealth index.
Nighttime situation
Assessment of the situation over a night period: transport, power supply, military tactical level.
Emergencies and fires
Nighttime emergency monitoring, fire photomaps, control of emergency recovery works.
Light pollution and urbanization
Monitoring of light pollution and growth of urbanized areas using nighttime lights (NTL) data.
Did not find your task?
Describe the territory, period and goal — we will check the nighttime imagery archive and the feasibility of a new survey.
What you will receive as a result of the order
01
Nighttime satellite images
Nighttime satellite images of various types: black-and-white, colour, multispectral and synthesized.
Selection of archive or new survey by coordinates, period and requirements for resolution, off-nadir angle and cloud cover.
What you get
- nighttime images in the agreed form
- materials for the archive period or a new survey
- delivery on electronic media or via FTP
Frame availability depends on the operator archive, cloud cover and the actual survey date. Not every territory has an image for a specific night.
02
Thematic materials
Thematic nighttime survey materials for: infrastructure, energy, emergencies, vessels, urbanization and light pollution.
The composition is defined by the terms of reference and the task to be solved with nighttime data.
What you get
- thematic nighttime survey materials
- image processing with specialized software
- formats agreed in the ToR
The set of thematic products is fixed in the contract and the terms of reference.
03
Radar
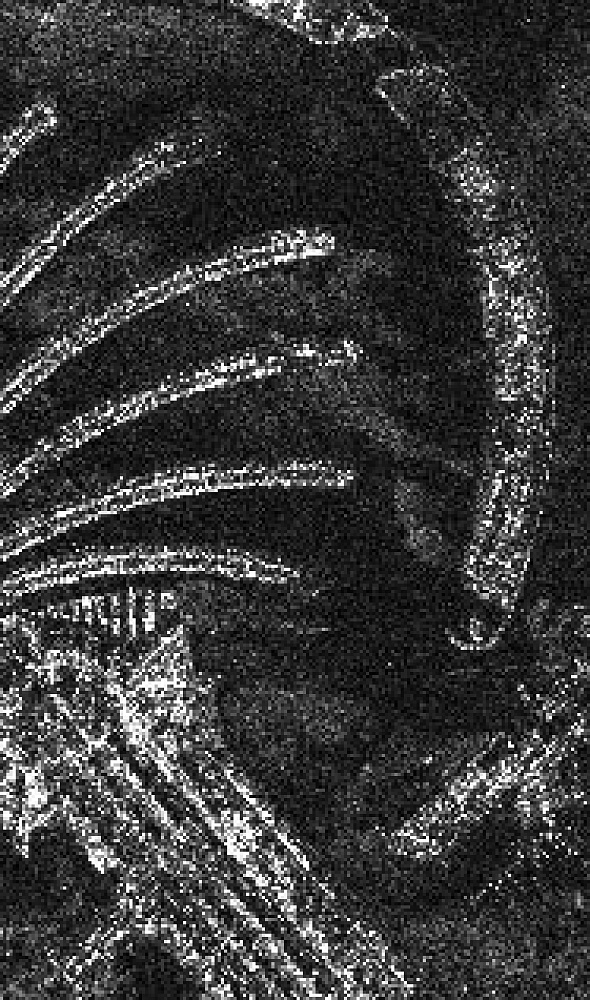
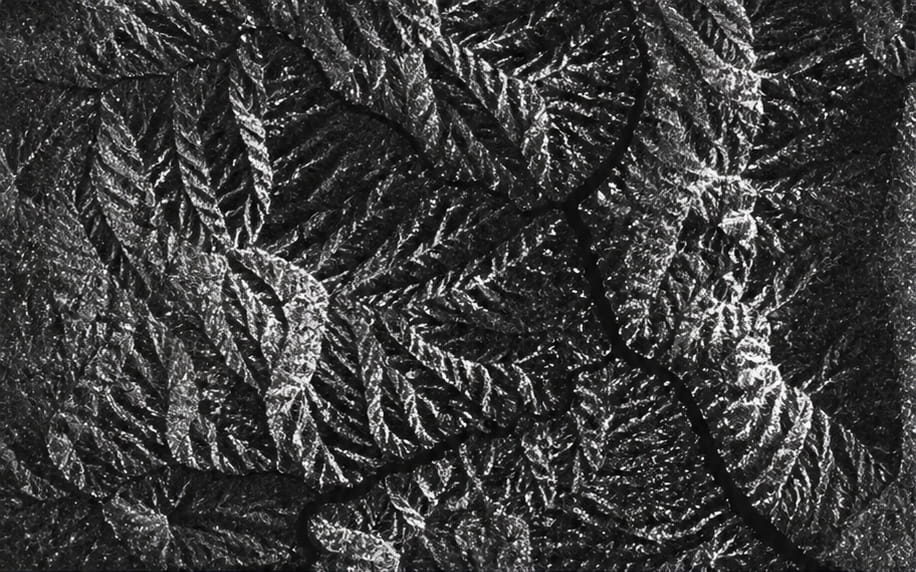
Nighttime radar satellite materials for comparative analysis with IR nighttime imagery — by agreement with the client.
Radar does not replace optical and IR nighttime imagery: the comparative set is agreed separately.
What you get
- radar materials if agreed
- comparison with IR nighttime imagery
- incoming quality control of images
Radar survey is included only by agreement with the client.
04
Maps and report
Topographic and thematic maps per the client's tasks, an analytical and statistical report with conclusions for decisions.
Finished products are delivered on electronic media or via FTP according to the terms of reference.
What you get
- maps for the stated tasks
- an analytical and statistical report
- documents listed in the contract
The composition of maps, the report and delivery formats are fixed in the contract and the ToR.
How the work goes
Cost and timeline
The cost depends on archive or new survey, resolution, area and whether you provide your own materials.
- consultation — free
- image selection and preliminary analysis — free
- image order per the table: from 5 to 40 USD per 1 km² depending on archive or new survey and resolution — if the client does not provide their materials or free images cannot be used
- the order steps state a range from 7 to 40 USD per 1 km² depending on archive or new survey and resolution
- service-card guide — from 30 000 ₽; the final price is calculated individually
- timeline in the time field — from 5 days; in the table, deadline block, FAQ and order steps — from 5 business days from receipt of 100% advance for nighttime survey materials
- the timeline depends on survey area, number and type of images (mono-stereo), parameter requirements and archive availability
- payment: 100% advance invoice for remote sensing materials after the contract, the rest after the work is completed; bank transfer only
Order guide — from 30 000 ₽
Timeline — from 5 business days
Consultation and preliminary selection — free
What data is needed for a quote
To assess feasibility, cost and timeline, provide:
- a description of the task that needs nighttime satellite imagery
- object location: coordinates, district/region name, SHP file
- period requirements: archive data or a new survey
- quality requirements: mono-stereo, off-nadir angles, ground resolution, cloud cover, sun angle, panchromatic or multispectral survey
- if parameters are missing — the intended use of remote sensing materials: specialists will propose an option
If technical parameters are unknown, describing the intended use of the data is enough — specialists will propose a suitable option.
Describe the territory, task and period — we will assess the nighttime imagery archive and the scope of work.
Why Innoter
Prompt access to archives
Suitable archive materials can be obtained faster if the required territory and date are already held by operators.
No aviation permits
A new satellite survey does not require the flight permits typical of aerial survey.
Large and remote territories
A single satellite pass covers large areas and makes it possible to work with hard-to-reach regions.
Direct agreements with operators
Distribution agreements help select archive imagery and order a new survey from different suppliers.
Software and server infrastructure
Modern software and capacity for quality control and processing of large data volumes.
Experienced domain specialists
Many years of experience on complex projects and specialists in cartography, photogrammetry and remote sensing.
Nighttime imagery, sensors and order constraints
The composition depends on archive or new survey, resolution, order area and nighttime-period requirements.
1
Images of the Earth at night provide geographic data about people and resources in dark conditions. Artificial light, including dim lighting and moonlight, highlights activity that is not as visible in daytime.
Remote sensing satellites with VIIRS sensors and the DNB (Visible Infrared Imaging Radiometer Suite Day-Night Band) are equipped with infrared hardware and transmit nighttime images in DNB. The number of low-orbit and geostationary platforms with multispectral cameras in the visible range 0.4–1 μm and near–mid–far IR 1–20 μm is growing.
In the 1970s the United States Department of Defense launched the DMSP programme: the nighttime surface was imaged for ice and snow clouds in the visible range under moonlight and for clouds in IR without moonlight. The OLS optical telescope and the DMSP-OLS database are used by the military and civilians under NOAA management.
2
A nighttime satellite image records emissions from human activity: lights of cities, towns, villages, industrial and agricultural infrastructure, mining, gas flares, fishing vessels — and natural lights, lightning, the Moon, microorganisms and animals.
Nighttime lighting images have for decades been a global data source on socio-economic factors. Uses: defence and reconnaissance; protection of national borders; economic and infrastructure development; energy, faults and outages; population distribution and density; nighttime search-and-rescue in emergencies, fire seats, gas leaks; vessel detection; airports; fisheries; geology; light-pollution monitoring; analysis of illumination and growth of urbanized areas, municipal services.
3
The goal is a picture of the Earth's nighttime environment, regions, territories and objects: “night maps”, photos and video of constant light emission. Nighttime remote sensing data, statistics, maps and texts yield a territorial and object situation that complements daytime imagery.
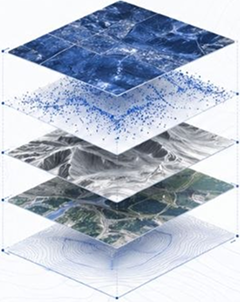
Tasks: topographic maps and plans; thematic maps of economic growth, poverty and inequality where data are scarce; a geospatial household wealth index; engineering-topographic maps; assessment of the situation over a night period, including dynamics (military tactical level, road and rail traffic, fisheries, power supply); monitoring of changes over years; a base for thematic geological and infrastructure maps in the IR range; monitoring of emergencies and recovery works; light-pollution monitoring; fire photomaps; integration of nighttime lights (NTL) data with images from Landsat, Sentinel, WorldView, JL1-3B, Aster, Modis and other spacecraft.
4
High-resolution 0.5–1 m sensors provide detailed nighttime imagery as stills and video. Combining IR from different spacecraft yields analytics after processing or online. On small platforms: a high-sensitivity nighttime video camera with a 0.319 μm passband on a 3 m resolution, 20 kg remote sensing microsatellite.
Medium-resolution data can be taken from open sources and combined with 0.5–3 m high-resolution images from GEO Innoter if the client requires it. For nighttime monitoring, frames are often already in the operator archives; a new survey does not require approvals from government bodies. The area of a satellite image is substantially larger than a frame from an aircraft or UAV.
As a rule, the minimum order area for archive images is 25 km², for a new survey — 100 km². Minimum order strip width is from 2 to 5 km depending on the operator, mode and product.
5
Materials from an aircraft or UAV have high visual informativeness and metric properties, but nighttime survey takes longer: flight-permit approval, relocation of the aircraft or UAV with operators, and a multiply higher cost per 1 km².
The resolution of nighttime satellite images makes it unnecessary to use aviation and UAVs at night: under current flight regulations such conditions are often impractical. Satellite survey is more objective because the human factor has less influence.
6
Exact coordinates of the area of interest and requirements for the materials are needed: ground resolution, survey type, maximum image off-nadir angle, maximum allowable cloud cover, nighttime survey period.
If the information cannot be provided — state the intended use of the remote sensing materials: specialists will analyse the requirements and propose an option.
Frequently asked questions
Answers to key questions about service parameters, timelines, deliverable formats and workflow. If you did not find what you need — contact us and we will help.
- The task that needs to be solved using nighttime satellite images;
- area of interest (location / coordinates of the object in any convenient form, and the object area);
- the date or time interval for which archive imagery can be selected or a new survey performed;
- survey requirements (image off-nadir angle, spatial resolution, nighttime survey type, cloud cover, whether snow cover is acceptable)
As a rule, the minimum order area of archive satellite images is 25 km2, and for a new satellite survey — 100 km2. The minimum order-strip width (distance between the two nearest points) may be from 2 to 5 km depending on the spacecraft operator, survey mode and product.
- For a new survey: if the work area is known in advance but images with the required parameters are absent from spacecraft-operator archives, and the allowed time window is large enough to complete the survey in standard mode (without extra pay for acceleration and priority), there is an option of a speculative survey — i.e. de facto a new survey but without a purchase obligation. Because archive remote sensing materials are cheaper than ordering a new survey, once images from the speculative survey enter the archive they can be purchased at a reduced price. After 60 days the price is typically reduced further.
- For new and archive survey: If the area of interest is a set of separate, unconnected polygons, each smaller than the minimum order area (25 km2 archive survey or 100 sq. km (see item 1)), to reduce the total cost it is advisable to merge them into polygons each larger than the minimum order area.
The timeframe depends on the area of the territory and survey-parameter requirements. The minimum execution time is from 5 business days.
100% prepayment on the invoice for remote sensing materials after the contract is signed; the remaining payment after the work is completed.
YES. We work with individuals and legal entities, individual entrepreneurs, state and municipal authorities, foreign customers and others.
While the human eye can't pick up the difference in a daylight image of dark spots, and automatic panchrome decoding doesn't pick up darkness at all, the infrared sensor on the VIIRS is more perceptive, and this variability shows up in the dataset. Those dark areas that you see can actually still be quite active and can be classified.
- It is critical that users use a cloud-free nighttime observation file and do not assume that a value of zero in the mean brightness image means that no light has been observed. Cloud detection for nighttime panchromatic satellite images in the visible and near-infrared (VNIR) is typically performed based on the
- synchronized thermal infrared (TIR) observations, therefore cloud detection is
- cloud detection based on VNIR alone is analyzed. To classify clouds compared to clear images are focused, e.g., in urban areas, describe:
- cloud scattering, especially over urban areas with their inhomogeneous light emission;
- normalized differences between the albedo of the ground surface and clouds, especially in the presence of lunar illumination.
- Research on nighttime lights has shown that they are a reliable indicator of urbanization patterns and socio-economic indicators, such as population density and poverty, as well as the economic consequences of natural disasters and social conflicts. For instance, nighttime satellite imagery has been used in China to understand past epidemics and the COVID-19 pandemic in different regions of the country. Nighttime imagery has also been combined with daytime imagery to build statistical models for various analyses.
- These studies have utilized nighttime satellite imagery to gain insights into the dynamics of Asian cities' urbanization and its socio-economic implications. They have also explored the relationships between nighttime lights and population density, poverty, natural disasters, and social conflicts, providing valuable information for various research and decision-making purposes.
- References:
- Spatial Dynamics of Asian Cities
- Population Density Study
- Poverty Study
- Economic Consequences of Natural Disasters
- Social Conflicts Study
- Past Epidemics Study
- COVID-19 Pandemic Study
Nighttime satellite imagery can be obtained not only in Europe, Asia, Africa and America, but worldwide.
Russia. Bright city of Moscow photo: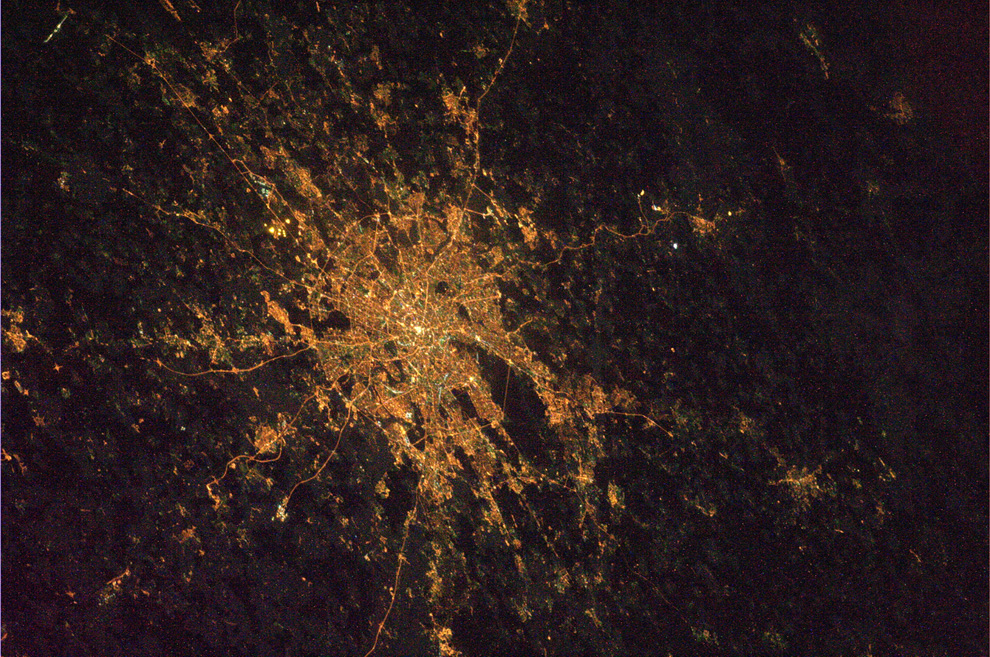
Russia. City of Orenburg photo:
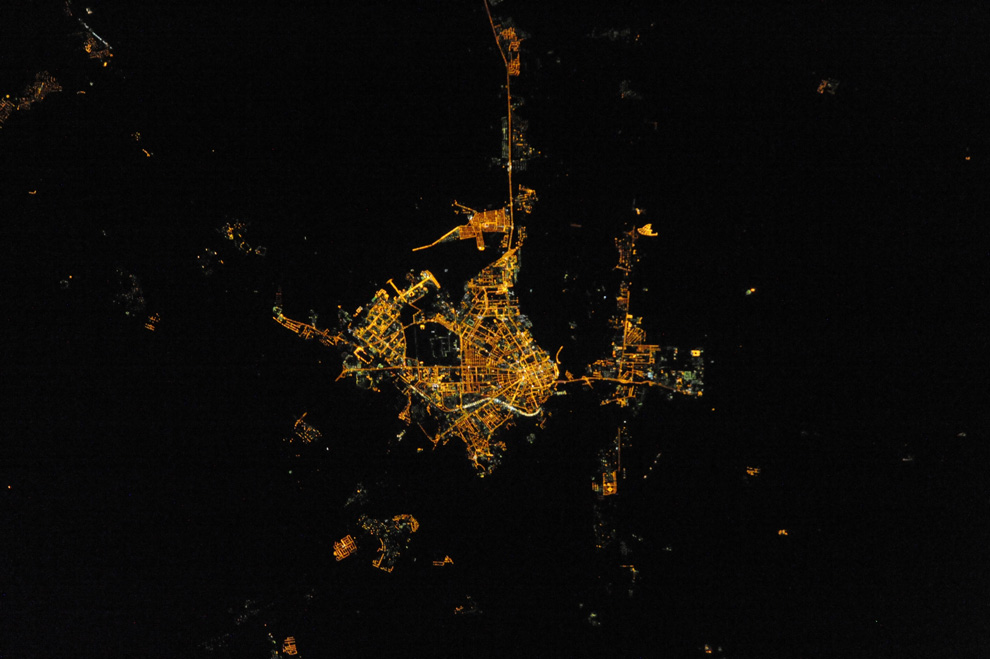
Russia. City of Saratov photo: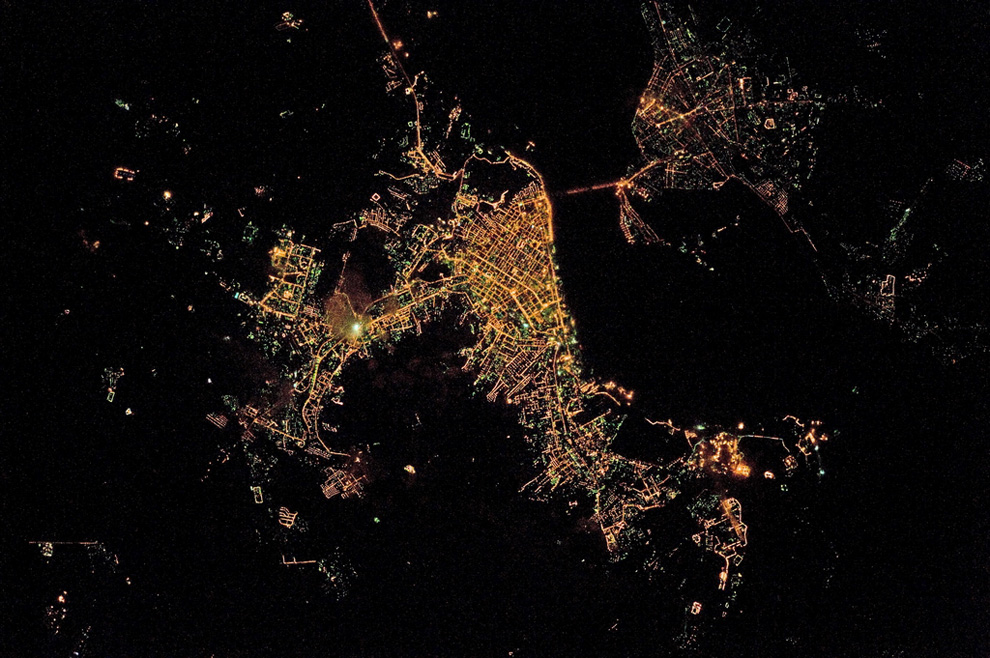
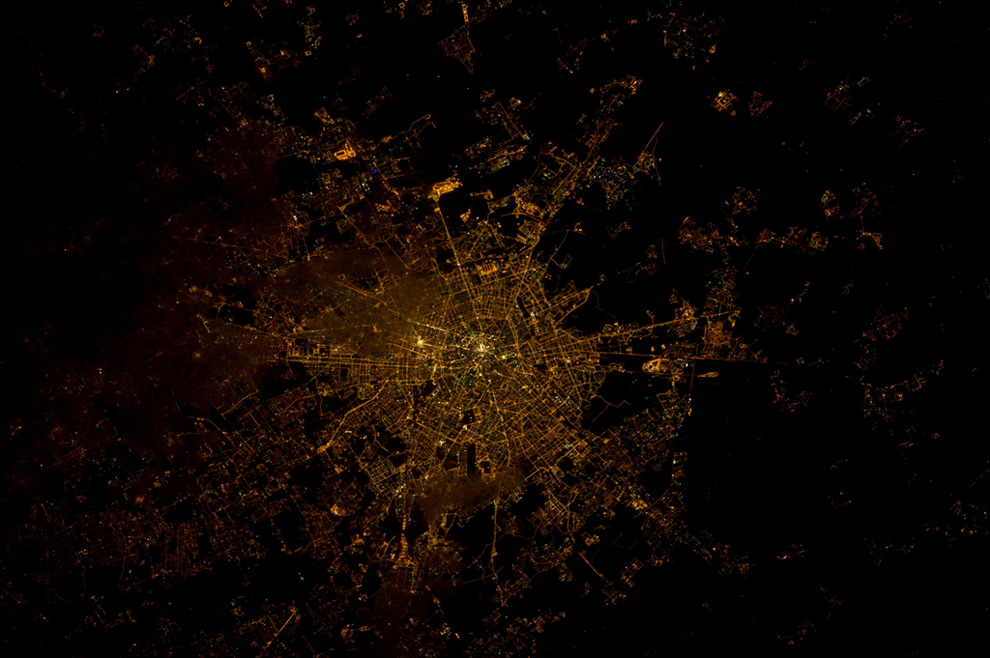
Europe. Milan, a city in northern Italy photo:
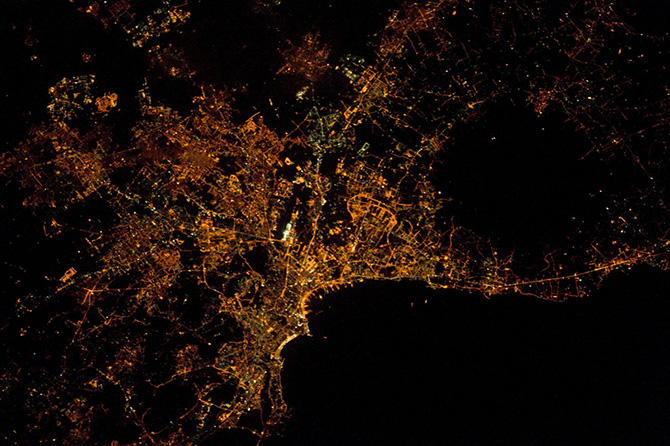
Italy. Naples on the seashore. The largest city in Southern Italy photo:
Africa, cities at night photo:
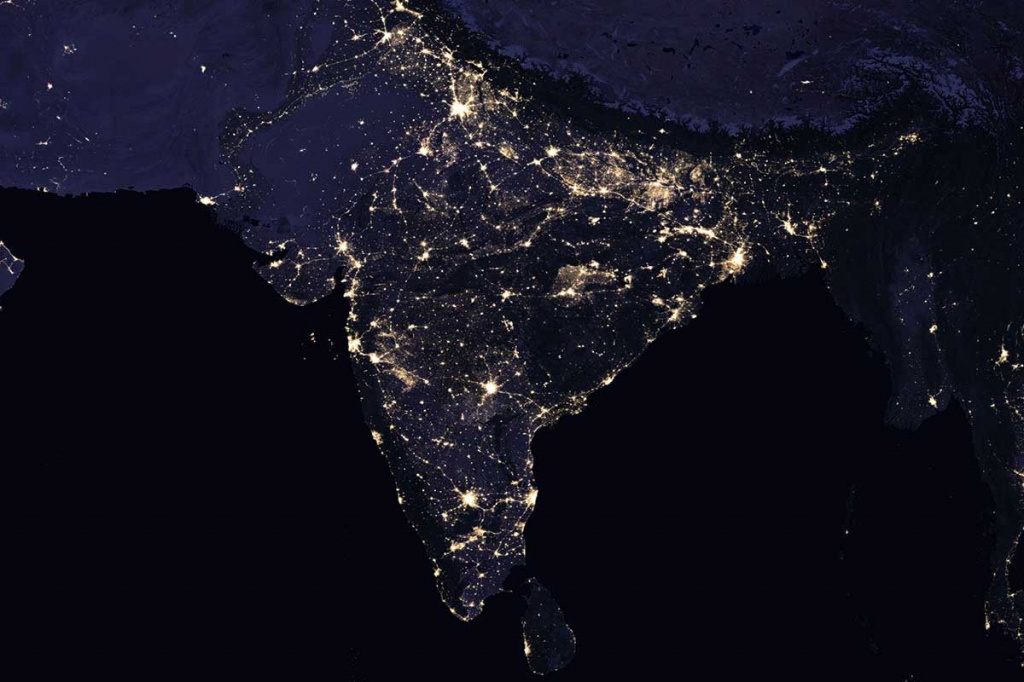
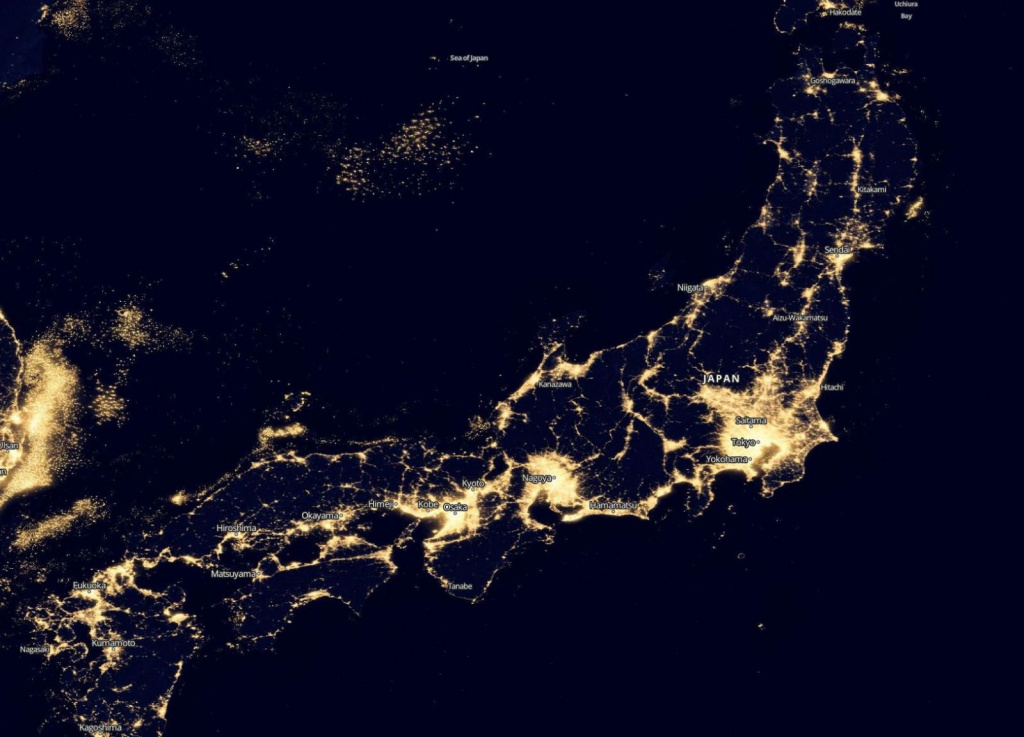
Asia, Tokyo city in Japan photo:
Russia. Bright city of Moscow photo:
Russia. City of Orenburg photo:
Russia. City of Saratov photo:
Europe. Milan, a city in northern Italy photo:
Italy. Naples on the seashore. The largest city in Southern Italy photo:
Africa, cities at night photo:
Asia, Tokyo city in Japan photo:
Need satellite imagery or help choosing the right data?
Describe your task, area of interest, and desired outcome. We will check data
availability, assess new acquisition options, and propose the optimal solution in terms of timelines, cost,
and quality.
Discuss the project
clients who trust us
25+ years in the geodata market